| __timestamp | Automatic Data Processing, Inc. | ITT Inc. |
|---|---|---|
| Wednesday, January 1, 2014 | 2616900000 | 386700000 |
| Thursday, January 1, 2015 | 2355100000 | 402700000 |
| Friday, January 1, 2016 | 2579500000 | 378000000 |
| Sunday, January 1, 2017 | 2927200000 | 415000000 |
| Monday, January 1, 2018 | 2762900000 | 469000000 |
| Tuesday, January 1, 2019 | 3544500000 | 513900000 |
| Wednesday, January 1, 2020 | 3769700000 | 455000000 |
| Friday, January 1, 2021 | 3931600000 | 545600000 |
| Saturday, January 1, 2022 | 4405500000 | 554500000 |
| Sunday, January 1, 2023 | 5244600000 | 639100000 |
| Monday, January 1, 2024 | 5800000000 | 821500000 |
Cracking the code
In the ever-evolving landscape of corporate finance, EBITDA serves as a crucial indicator of a company's operational efficiency. This analysis juxtaposes the EBITDA performance of Automatic Data Processing, Inc. (ADP) and ITT Inc. over a decade, from 2014 to 2023.
ADP has demonstrated a robust growth trajectory, with its EBITDA increasing by approximately 122% over the period. Starting at around $2.6 billion in 2014, ADP's EBITDA reached an impressive $5.2 billion by 2023. This consistent upward trend underscores ADP's strategic prowess in navigating market challenges.
ITT Inc., while smaller in scale, has shown commendable resilience. Its EBITDA grew by nearly 65%, from $387 million in 2014 to $639 million in 2023. Despite missing data for 2024, ITT's performance reflects its adaptability and operational strength.
This comparative analysis highlights the dynamic nature of these industry leaders, offering valuable insights for investors and stakeholders.
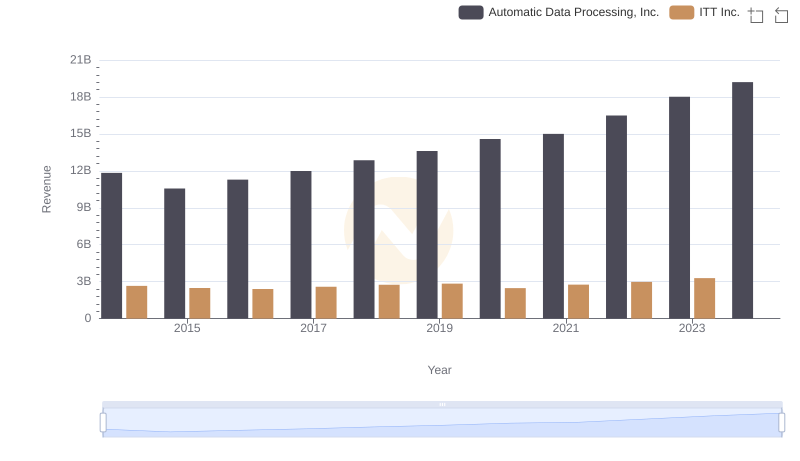
Automatic Data Processing, Inc. and ITT Inc.: A Comprehensive Revenue Analysis
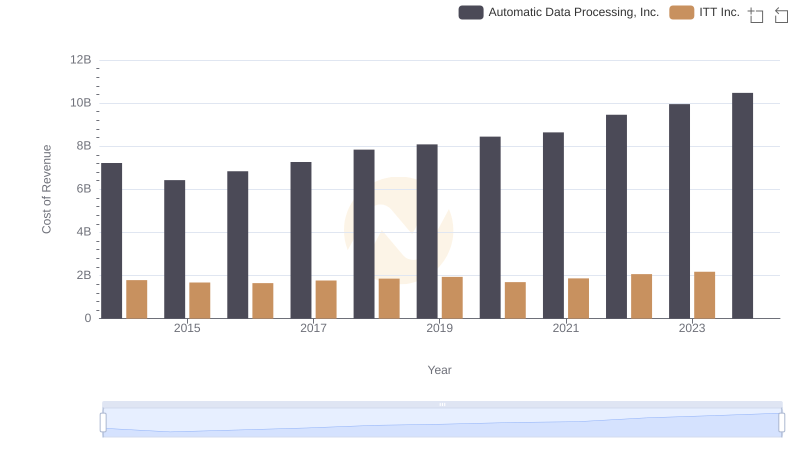
Comparing Cost of Revenue Efficiency: Automatic Data Processing, Inc. vs ITT Inc.

A Professional Review of EBITDA: Automatic Data Processing, Inc. Compared to U-Haul Holding Company

Comprehensive EBITDA Comparison: Automatic Data Processing, Inc. vs Elbit Systems Ltd.

Automatic Data Processing, Inc. vs Nordson Corporation: In-Depth EBITDA Performance Comparison
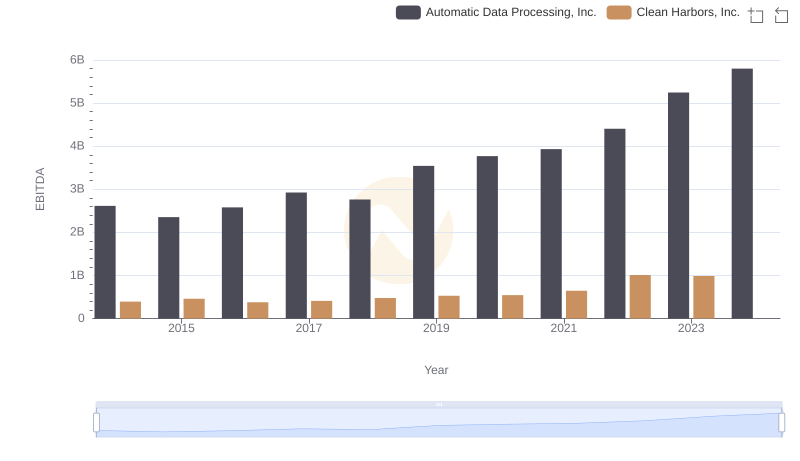
EBITDA Performance Review: Automatic Data Processing, Inc. vs Clean Harbors, Inc.
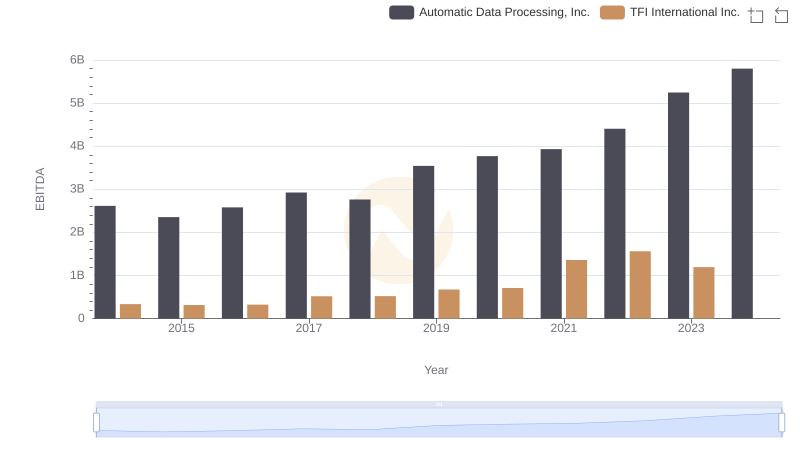
Automatic Data Processing, Inc. vs TFI International Inc.: In-Depth EBITDA Performance Comparison
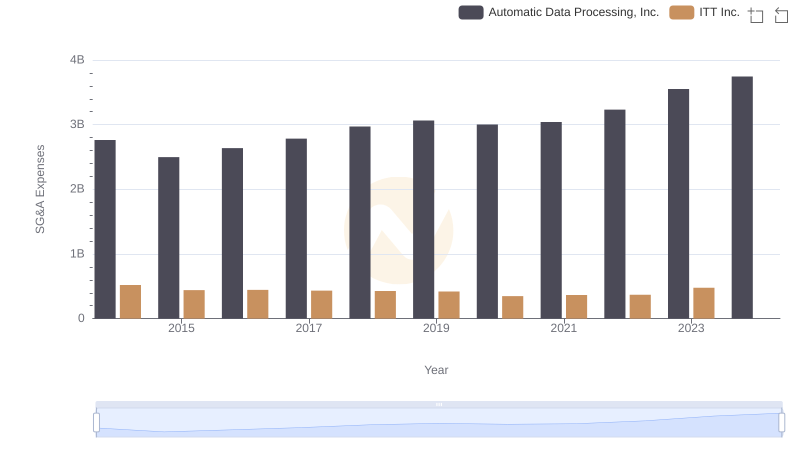
Who Optimizes SG&A Costs Better? Automatic Data Processing, Inc. or ITT Inc.
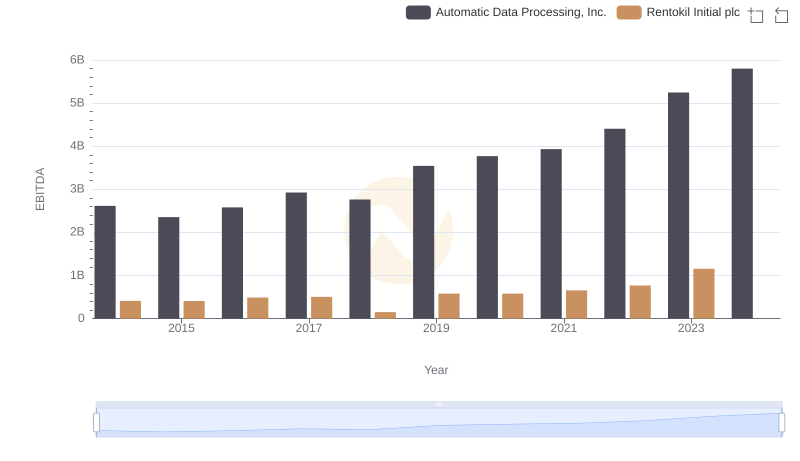
A Side-by-Side Analysis of EBITDA: Automatic Data Processing, Inc. and Rentokil Initial plc