| __timestamp | Snap-on Incorporated | Trane Technologies plc |
|---|---|---|
| Wednesday, January 1, 2014 | 1047900000 | 2503900000 |
| Thursday, January 1, 2015 | 1009100000 | 2541100000 |
| Friday, January 1, 2016 | 1001400000 | 2606500000 |
| Sunday, January 1, 2017 | 1101300000 | 2720700000 |
| Monday, January 1, 2018 | 1080700000 | 2903200000 |
| Tuesday, January 1, 2019 | 1071500000 | 3129800000 |
| Wednesday, January 1, 2020 | 1054800000 | 2270600000 |
| Friday, January 1, 2021 | 1202300000 | 2446300000 |
| Saturday, January 1, 2022 | 1181200000 | 2545900000 |
| Sunday, January 1, 2023 | 1249000000 | 2963200000 |
| Monday, January 1, 2024 | 0 | 3580400000 |
Infusing magic into the data realm
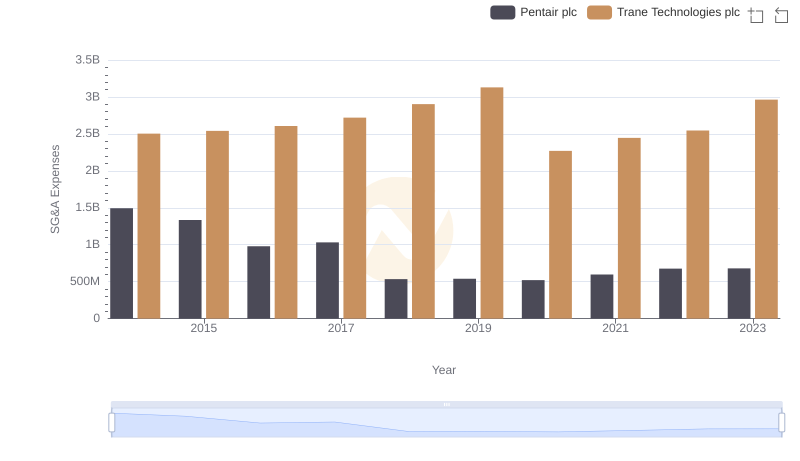
In the ever-evolving landscape of corporate finance, understanding the nuances of Selling, General, and Administrative (SG&A) expenses is crucial. Trane Technologies plc and Snap-on Incorporated, two giants in their respective industries, offer a fascinating study in contrasts. Over the past decade, Trane Technologies has consistently outpaced Snap-on in SG&A expenses, with figures peaking at nearly 3 billion in 2019. This represents a staggering 25% increase from 2014. In contrast, Snap-on's SG&A expenses have shown a more modest growth, with a 19% rise over the same period, reaching approximately 1.25 billion in 2023. This divergence highlights the differing strategic priorities and operational scales of these companies. As businesses navigate the complexities of the modern economy, such insights into SG&A trends can provide valuable guidance for investors and analysts alike.
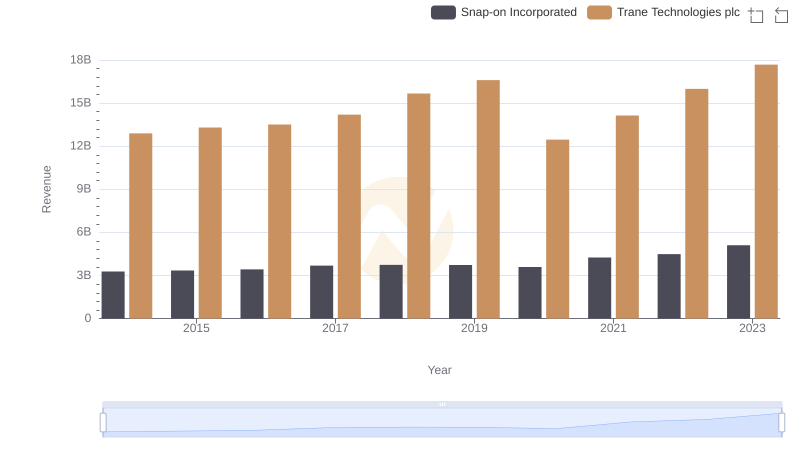
Annual Revenue Comparison: Trane Technologies plc vs Snap-on Incorporated
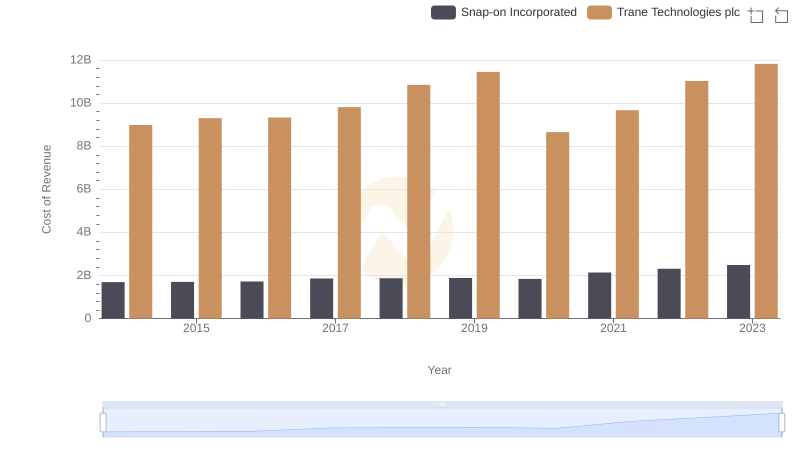
Cost Insights: Breaking Down Trane Technologies plc and Snap-on Incorporated's Expenses
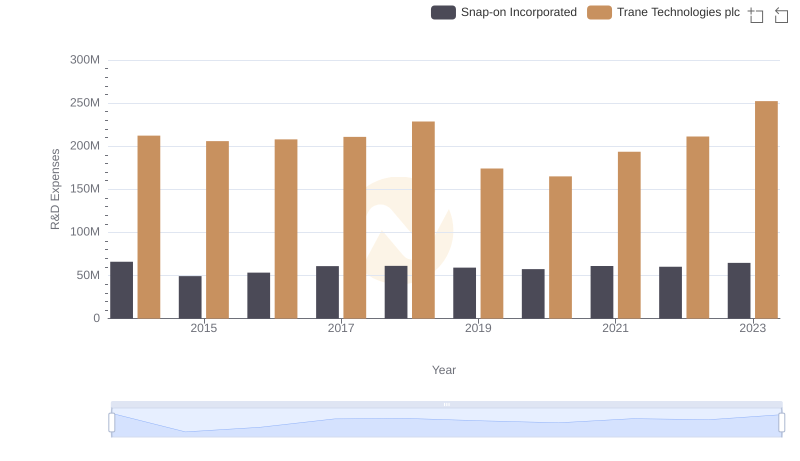
Who Prioritizes Innovation? R&D Spending Compared for Trane Technologies plc and Snap-on Incorporated
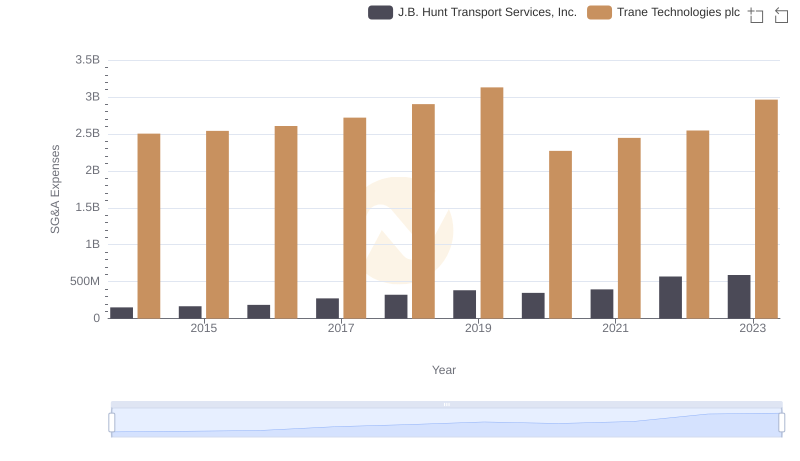
Trane Technologies plc or J.B. Hunt Transport Services, Inc.: Who Manages SG&A Costs Better?
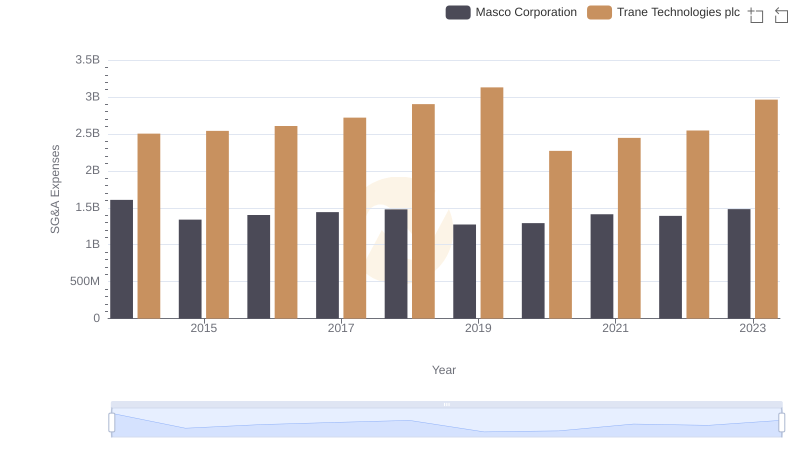
Operational Costs Compared: SG&A Analysis of Trane Technologies plc and Masco Corporation
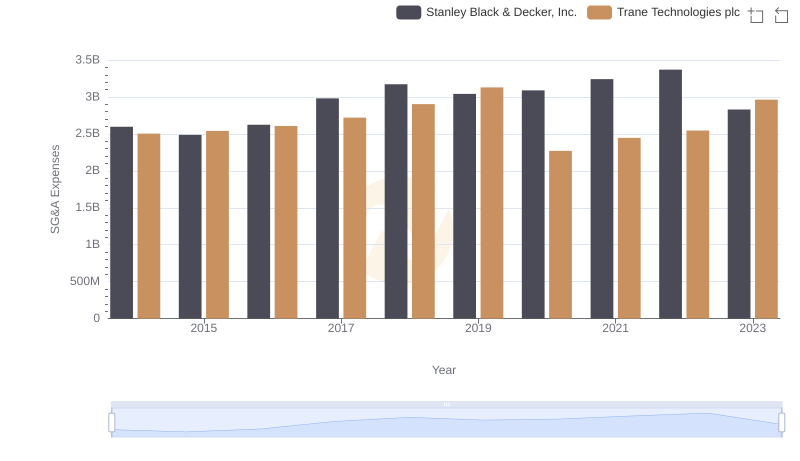
Trane Technologies plc and Stanley Black & Decker, Inc.: SG&A Spending Patterns Compared
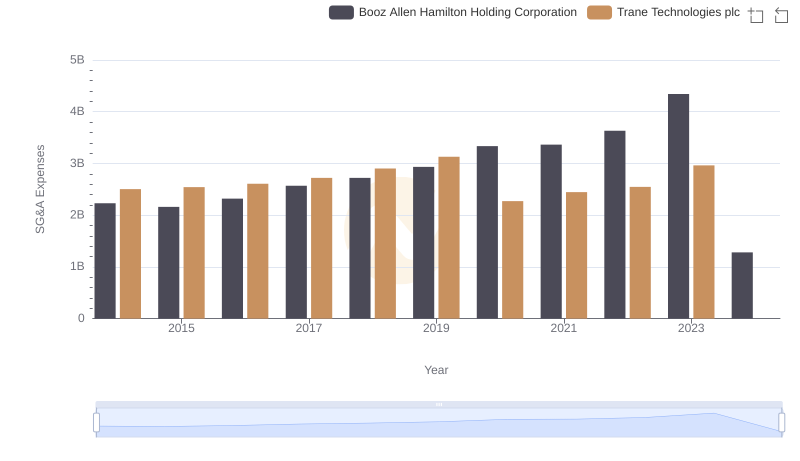
Trane Technologies plc and Booz Allen Hamilton Holding Corporation: SG&A Spending Patterns Compared
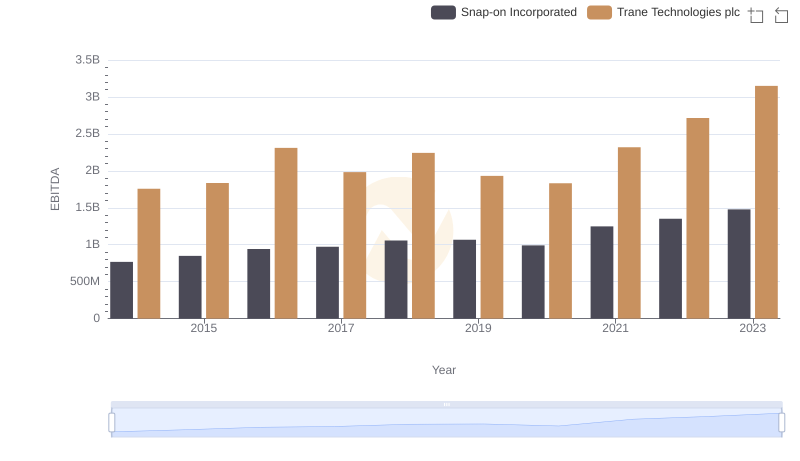
A Professional Review of EBITDA: Trane Technologies plc Compared to Snap-on Incorporated
SG&A Efficiency Analysis: Comparing Trane Technologies plc and Pentair plc