| __timestamp | C.H. Robinson Worldwide, Inc. | Old Dominion Freight Line, Inc. |
|---|---|---|
| Wednesday, January 1, 2014 | 12401436000 | 2100409000 |
| Thursday, January 1, 2015 | 12259014000 | 2214943000 |
| Friday, January 1, 2016 | 11931821000 | 2246890000 |
| Sunday, January 1, 2017 | 13680857000 | 2482732000 |
| Monday, January 1, 2018 | 15269479000 | 2899452000 |
| Tuesday, January 1, 2019 | 14021726000 | 2938895000 |
| Wednesday, January 1, 2020 | 15037716000 | 2786531000 |
| Friday, January 1, 2021 | 21493659000 | 3481268000 |
| Saturday, January 1, 2022 | 22826428000 | 4003951000 |
| Sunday, January 1, 2023 | 16457570000 | 3793953000 |
| Monday, January 1, 2024 | 16416191000 |
Igniting the spark of knowledge
In the competitive world of logistics and freight, cost efficiency is paramount. Over the past decade, Old Dominion Freight Line, Inc. and C.H. Robinson Worldwide, Inc. have showcased contrasting trends in their cost of revenue. From 2014 to 2023, C.H. Robinson's cost of revenue fluctuated, peaking in 2022 with a 64% increase from 2014, before dropping in 2023. Meanwhile, Old Dominion demonstrated a steady rise, with a 90% increase over the same period, reflecting their strategic cost management. Notably, 2023 data for C.H. Robinson shows a significant decline, hinting at potential operational shifts or market challenges. This analysis underscores the importance of adaptive strategies in maintaining cost efficiency in the ever-evolving logistics sector. Missing data for 2024 suggests a need for further investigation into recent trends.
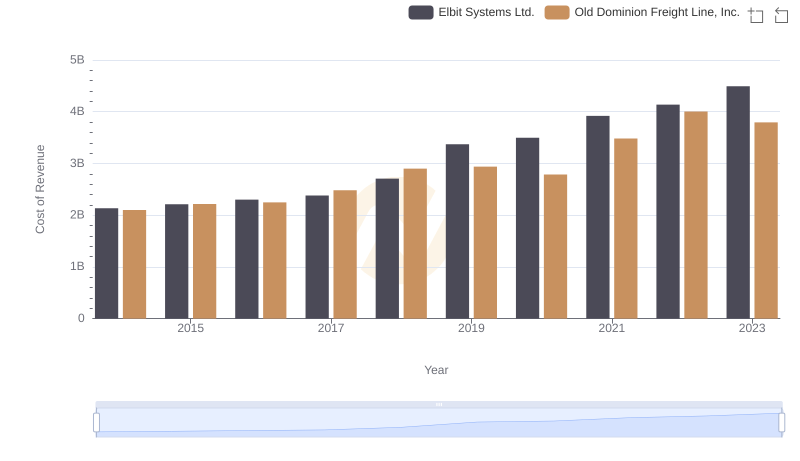
Analyzing Cost of Revenue: Old Dominion Freight Line, Inc. and Elbit Systems Ltd.
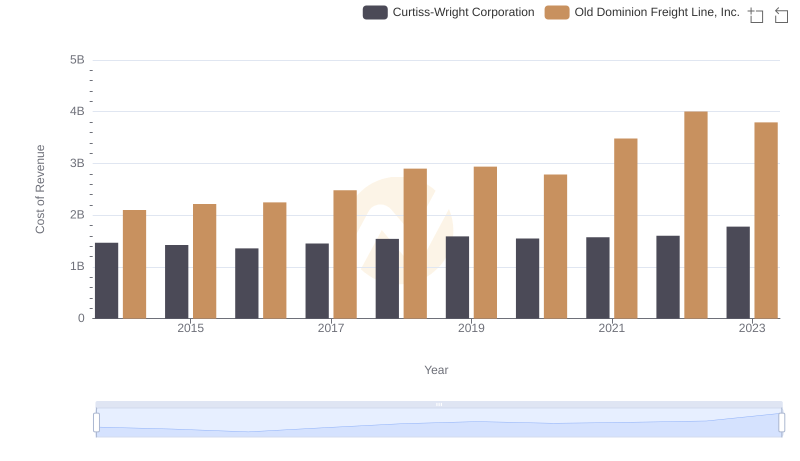
Cost of Revenue: Key Insights for Old Dominion Freight Line, Inc. and Curtiss-Wright Corporation
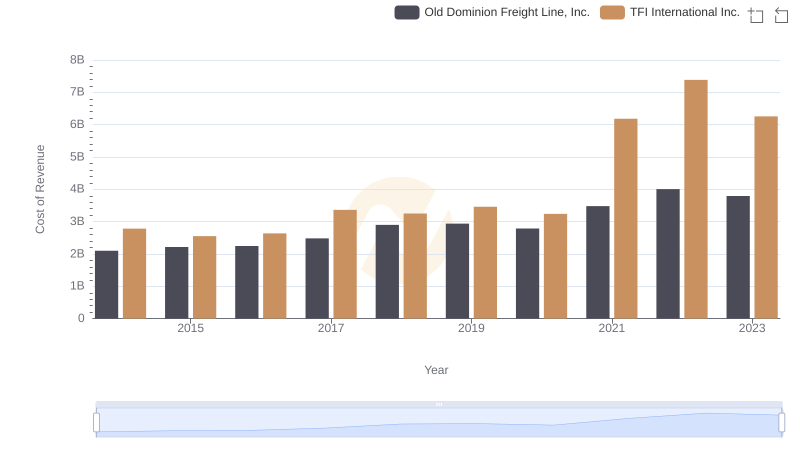
Cost of Revenue: Key Insights for Old Dominion Freight Line, Inc. and TFI International Inc.
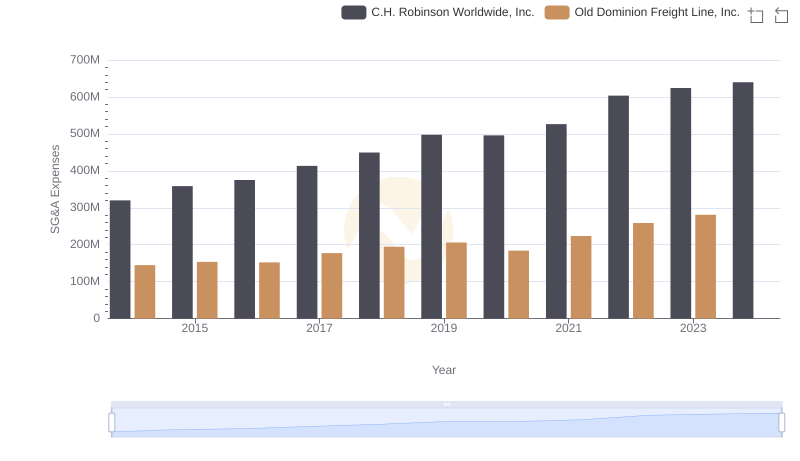
Comparing SG&A Expenses: Old Dominion Freight Line, Inc. vs C.H. Robinson Worldwide, Inc. Trends and Insights
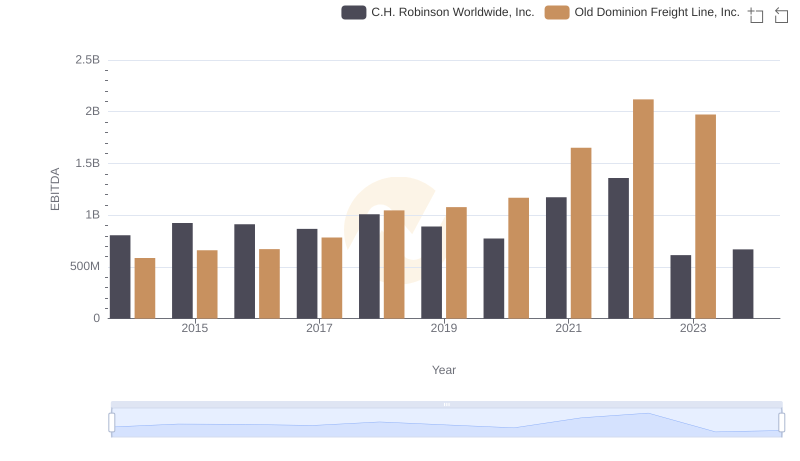
A Professional Review of EBITDA: Old Dominion Freight Line, Inc. Compared to C.H. Robinson Worldwide, Inc.