| __timestamp | Avery Dennison Corporation | Old Dominion Freight Line, Inc. |
|---|---|---|
| Wednesday, January 1, 2014 | 1651200000 | 687488000 |
| Thursday, January 1, 2015 | 1645800000 | 757499000 |
| Friday, January 1, 2016 | 1699700000 | 744627000 |
| Sunday, January 1, 2017 | 1812200000 | 875380000 |
| Monday, January 1, 2018 | 1915500000 | 1144243000 |
| Tuesday, January 1, 2019 | 1904100000 | 1170216000 |
| Wednesday, January 1, 2020 | 1923300000 | 1228598000 |
| Friday, January 1, 2021 | 2312800000 | 1775060000 |
| Saturday, January 1, 2022 | 2404200000 | 2256126000 |
| Sunday, January 1, 2023 | 2277499999 | 2072199000 |
| Monday, January 1, 2024 | 2530700000 |
Cracking the code
In the ever-evolving landscape of American industry, the financial performance of companies like Old Dominion Freight Line, Inc. and Avery Dennison Corporation offers a fascinating glimpse into their strategic prowess. Over the past decade, from 2014 to 2023, these two giants have showcased distinct trajectories in gross profit growth.
Avery Dennison, a leader in labeling and packaging materials, has consistently maintained a robust gross profit, peaking in 2022 with a 45% increase from its 2014 figures. Meanwhile, Old Dominion Freight Line, a titan in the freight and logistics sector, has demonstrated remarkable growth, with its gross profit surging by over 225% during the same period.
This comparison not only highlights the resilience and adaptability of these companies but also underscores the dynamic nature of their respective industries. As we look to the future, these trends offer valuable insights for investors and industry analysts alike.
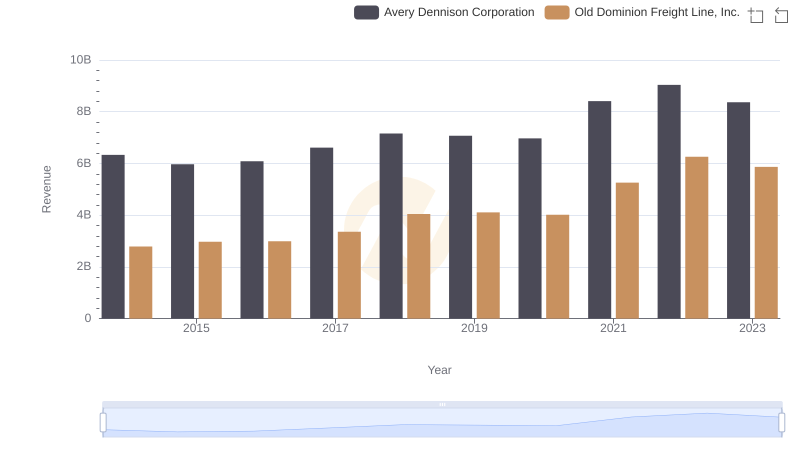
Old Dominion Freight Line, Inc. vs Avery Dennison Corporation: Examining Key Revenue Metrics
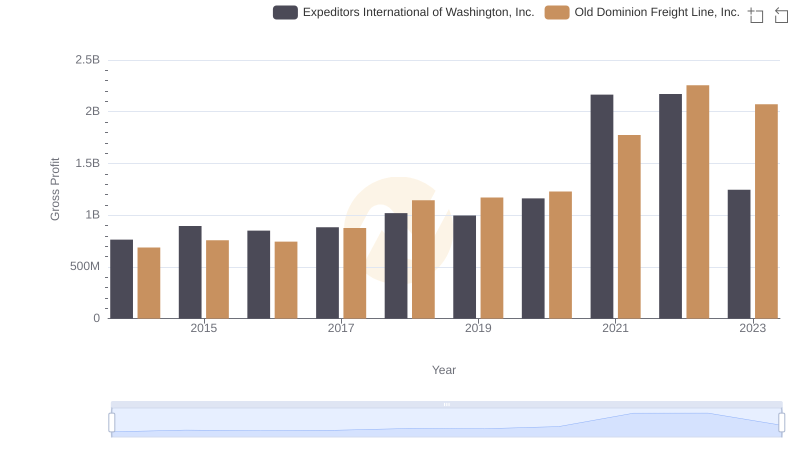
Gross Profit Analysis: Comparing Old Dominion Freight Line, Inc. and Expeditors International of Washington, Inc.
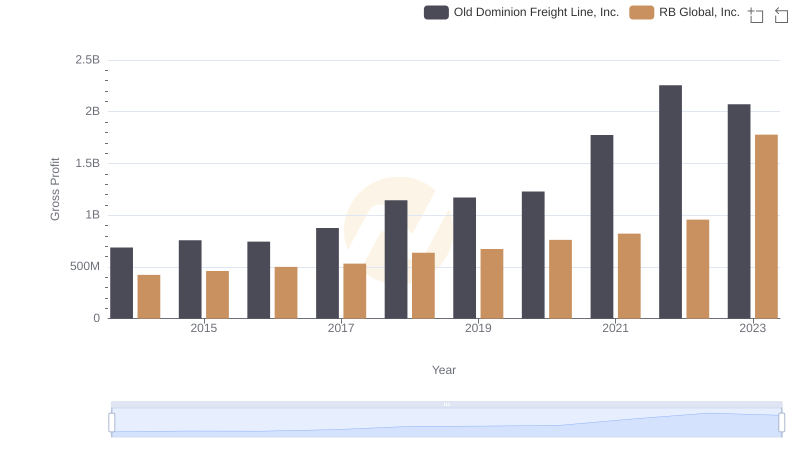
Key Insights on Gross Profit: Old Dominion Freight Line, Inc. vs RB Global, Inc.
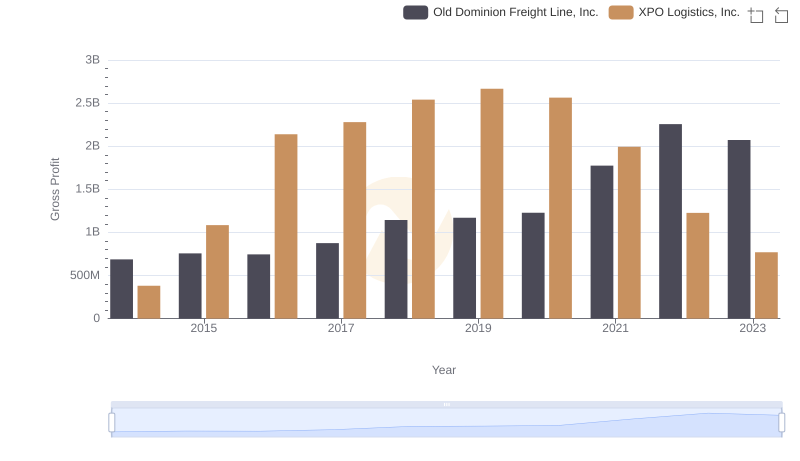
Key Insights on Gross Profit: Old Dominion Freight Line, Inc. vs XPO Logistics, Inc.
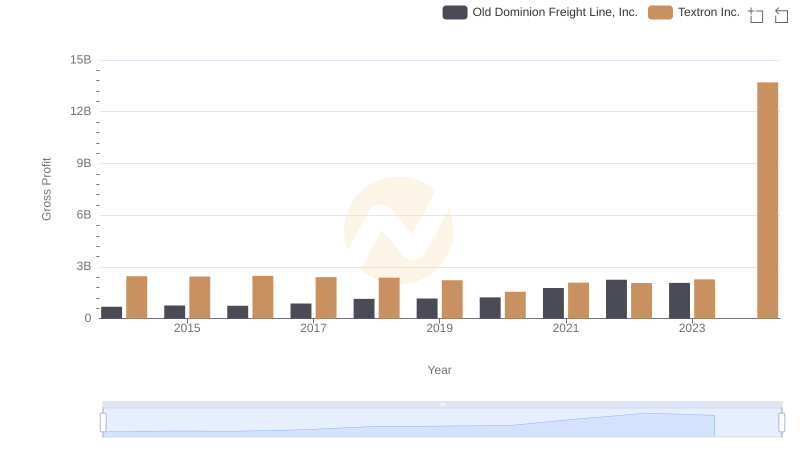
Old Dominion Freight Line, Inc. vs Textron Inc.: A Gross Profit Performance Breakdown
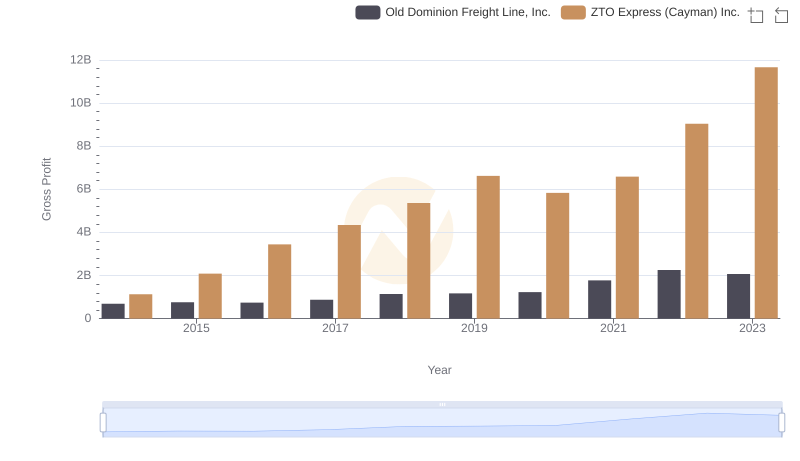
Gross Profit Comparison: Old Dominion Freight Line, Inc. and ZTO Express (Cayman) Inc. Trends
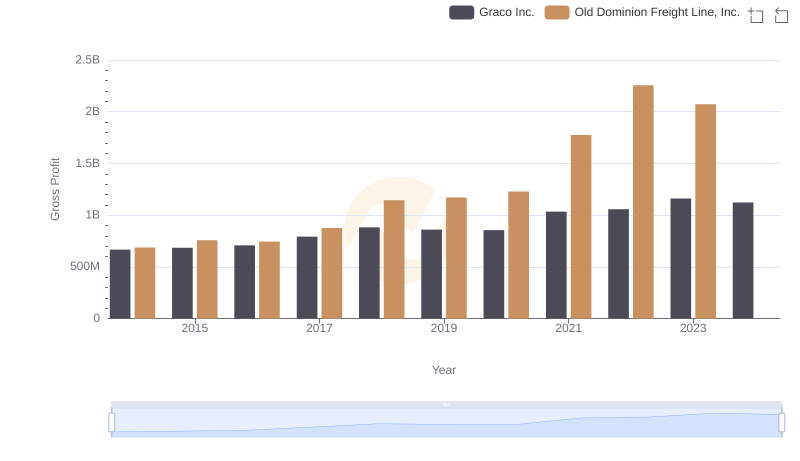
Old Dominion Freight Line, Inc. and Graco Inc.: A Detailed Gross Profit Analysis
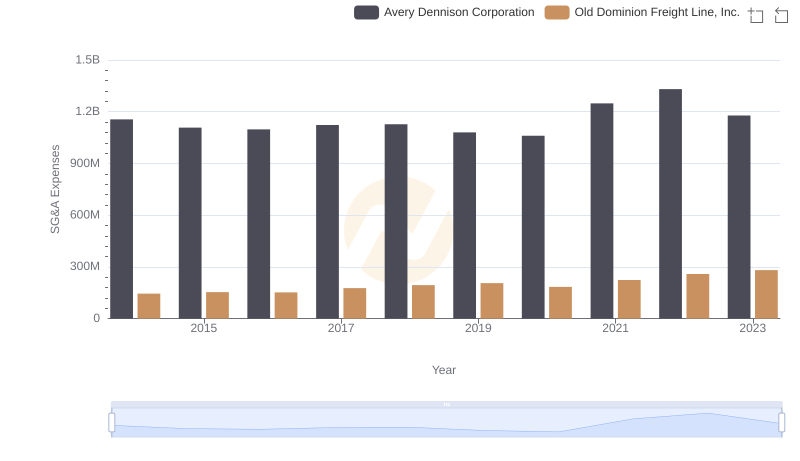
Cost Management Insights: SG&A Expenses for Old Dominion Freight Line, Inc. and Avery Dennison Corporation
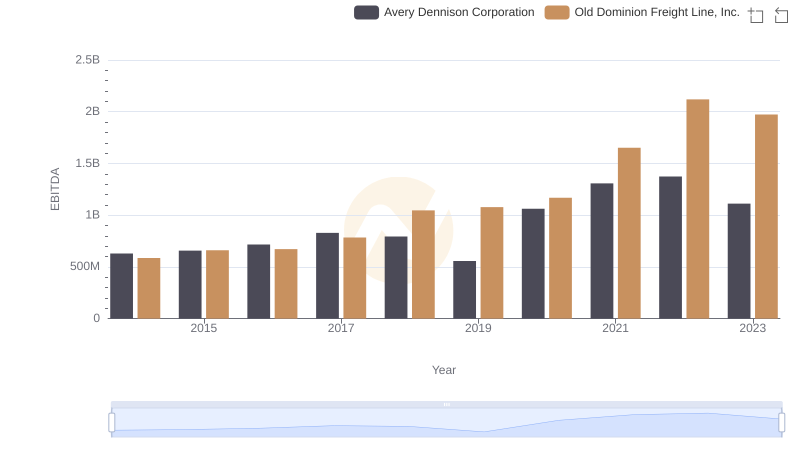
A Professional Review of EBITDA: Old Dominion Freight Line, Inc. Compared to Avery Dennison Corporation