| __timestamp | CSX Corporation | Comfort Systems USA, Inc. |
|---|---|---|
| Wednesday, January 1, 2014 | 12669000000 | 1410795000 |
| Thursday, January 1, 2015 | 11811000000 | 1580519000 |
| Friday, January 1, 2016 | 11069000000 | 1634340000 |
| Sunday, January 1, 2017 | 11408000000 | 1787922000 |
| Monday, January 1, 2018 | 12250000000 | 2182879000 |
| Tuesday, January 1, 2019 | 11937000000 | 2615277000 |
| Wednesday, January 1, 2020 | 10583000000 | 2856659000 |
| Friday, January 1, 2021 | 12522000000 | 3073636000 |
| Saturday, January 1, 2022 | 14853000000 | 4140364000 |
| Sunday, January 1, 2023 | 14657000000 | 5206760000 |
Unleashing insights
In the ever-evolving landscape of American industry, CSX Corporation and Comfort Systems USA, Inc. stand as titans in their respective fields. Over the past decade, from 2014 to 2023, these companies have showcased remarkable revenue trajectories. CSX Corporation, a leader in rail transportation, saw its revenue peak in 2022, marking a 40% increase from its 2016 low. Meanwhile, Comfort Systems USA, Inc., a key player in mechanical contracting, experienced a staggering 270% revenue growth over the same period, culminating in 2023. This growth underscores the resilience and adaptability of these companies amidst economic shifts. As we delve into their financial journeys, it becomes evident that strategic innovation and market adaptation are pivotal in sustaining growth. Explore the data to uncover the strategies that propelled these giants to new heights.

Breaking Down Revenue Trends: CSX Corporation vs Avery Dennison Corporation
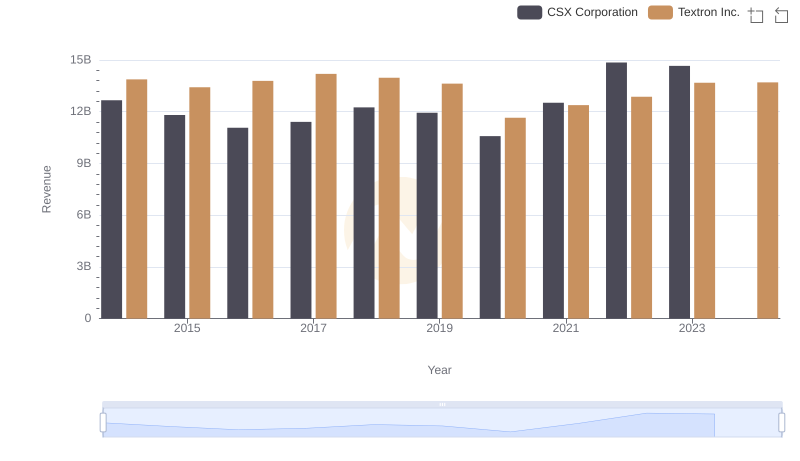
Who Generates More Revenue? CSX Corporation or Textron Inc.
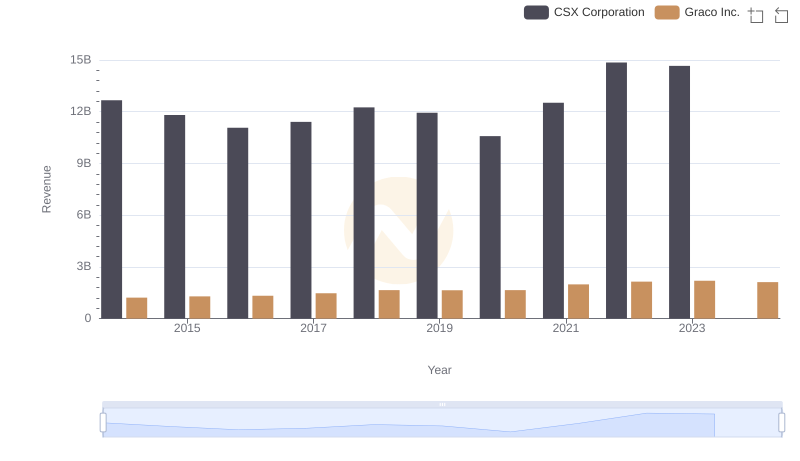
Who Generates More Revenue? CSX Corporation or Graco Inc.
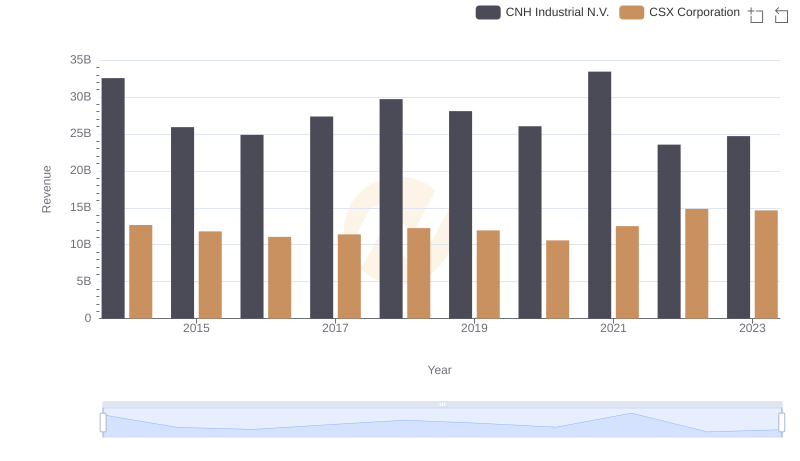
CSX Corporation vs CNH Industrial N.V.: Annual Revenue Growth Compared
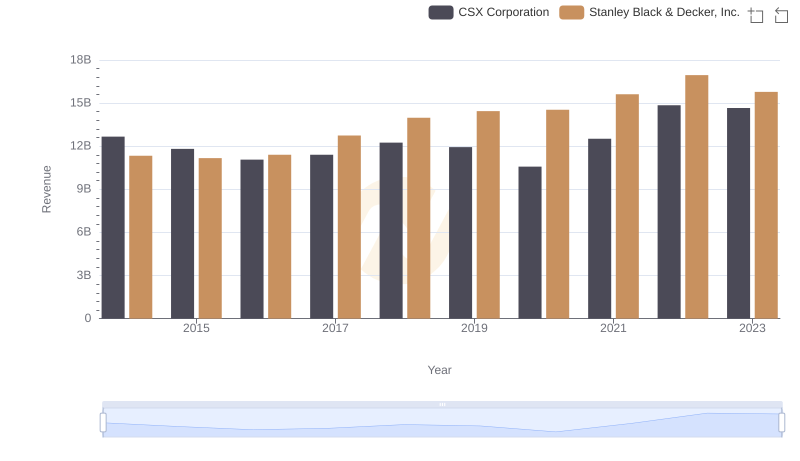
Breaking Down Revenue Trends: CSX Corporation vs Stanley Black & Decker, Inc.
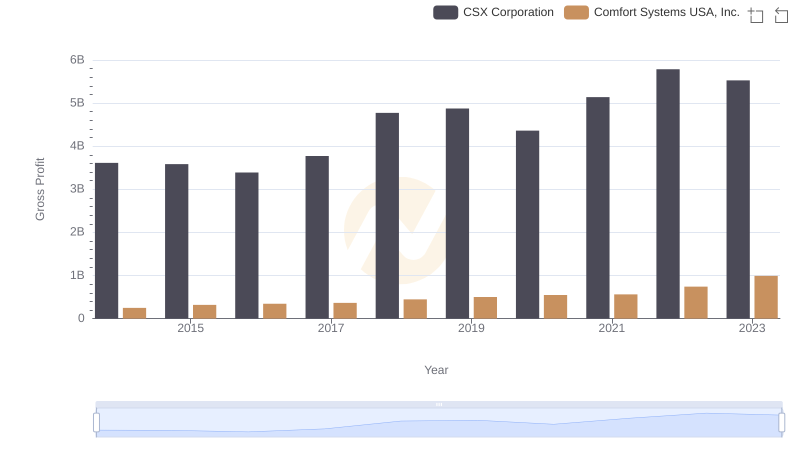
Gross Profit Trends Compared: CSX Corporation vs Comfort Systems USA, Inc.
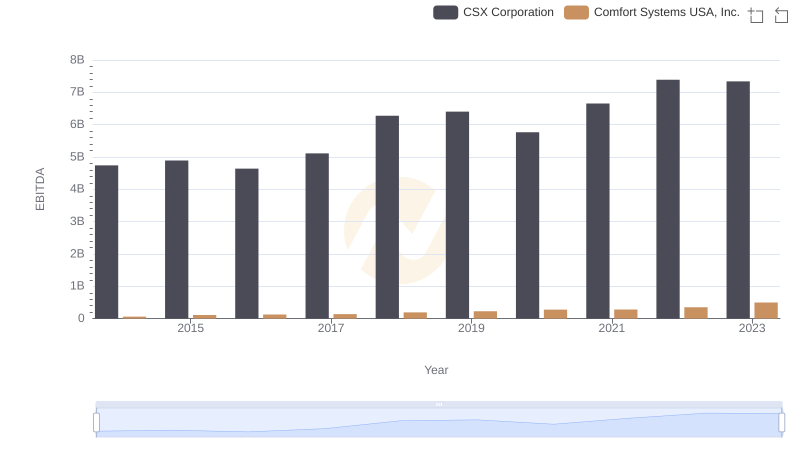
A Professional Review of EBITDA: CSX Corporation Compared to Comfort Systems USA, Inc.