| __timestamp | CSX Corporation | Comfort Systems USA, Inc. |
|---|---|---|
| Wednesday, January 1, 2014 | 3613000000 | 249771000 |
| Thursday, January 1, 2015 | 3584000000 | 318129000 |
| Friday, January 1, 2016 | 3389000000 | 344009000 |
| Sunday, January 1, 2017 | 3773000000 | 366281000 |
| Monday, January 1, 2018 | 4773000000 | 446279000 |
| Tuesday, January 1, 2019 | 4874000000 | 501943000 |
| Wednesday, January 1, 2020 | 4362000000 | 546983000 |
| Friday, January 1, 2021 | 5140000000 | 563207000 |
| Saturday, January 1, 2022 | 5785000000 | 741608000 |
| Sunday, January 1, 2023 | 5527000000 | 990509000 |
Cracking the code
In the ever-evolving landscape of American industry, CSX Corporation and Comfort Systems USA, Inc. offer a fascinating study in contrasts. Over the past decade, CSX Corporation, a leader in the transportation sector, has seen its gross profit grow by approximately 53%, peaking in 2022. Meanwhile, Comfort Systems USA, Inc., a key player in the building services industry, has experienced a remarkable 297% increase in gross profit, culminating in 2023.
From 2014 to 2023, CSX Corporation's gross profit consistently outpaced Comfort Systems USA, Inc., yet the latter's growth rate is noteworthy. By 2023, Comfort Systems USA, Inc. achieved nearly 1 billion in gross profit, a testament to its strategic expansion and market adaptation. This comparison highlights the diverse growth trajectories within different sectors of the U.S. economy, offering valuable insights for investors and industry analysts alike.
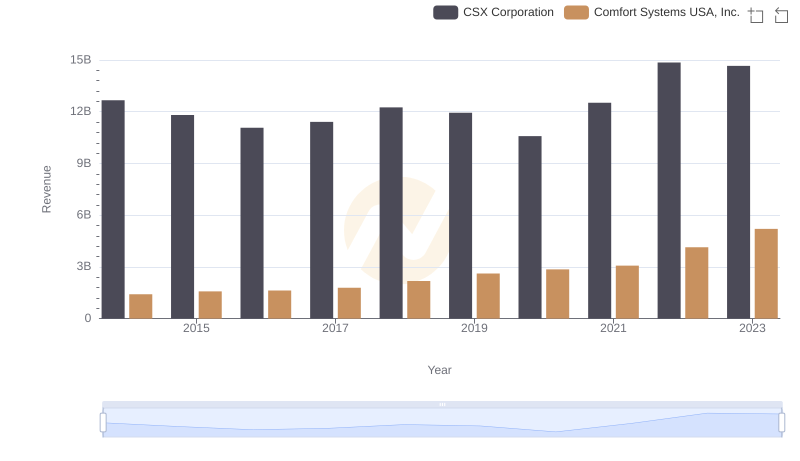
CSX Corporation and Comfort Systems USA, Inc.: A Comprehensive Revenue Analysis
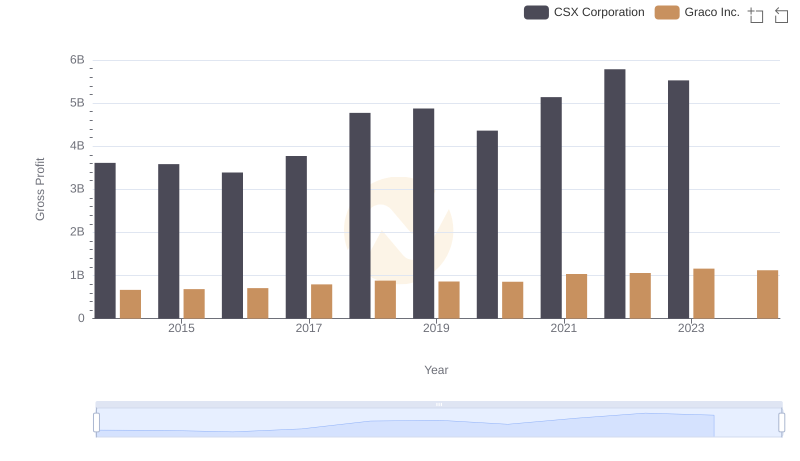
Gross Profit Comparison: CSX Corporation and Graco Inc. Trends
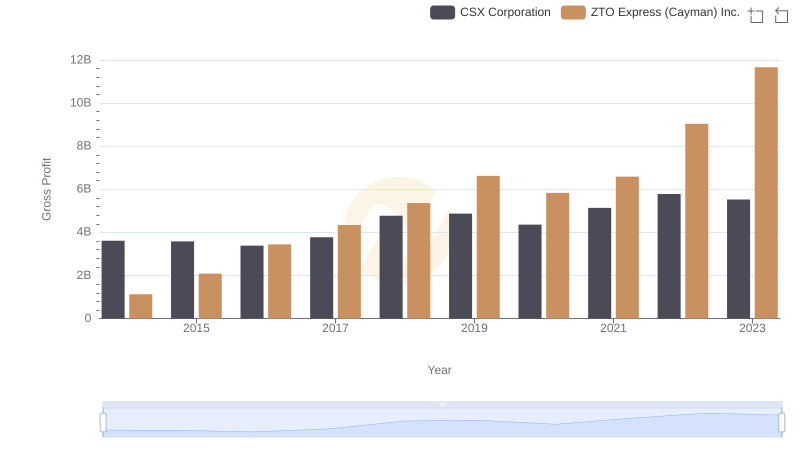
Gross Profit Comparison: CSX Corporation and ZTO Express (Cayman) Inc. Trends
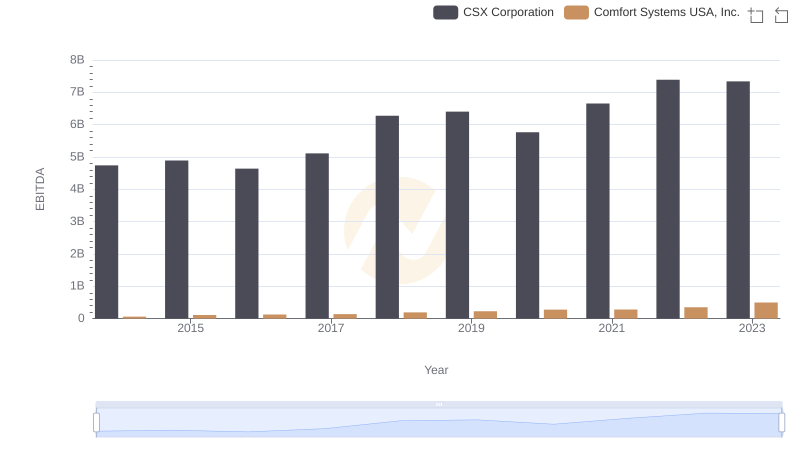
A Professional Review of EBITDA: CSX Corporation Compared to Comfort Systems USA, Inc.
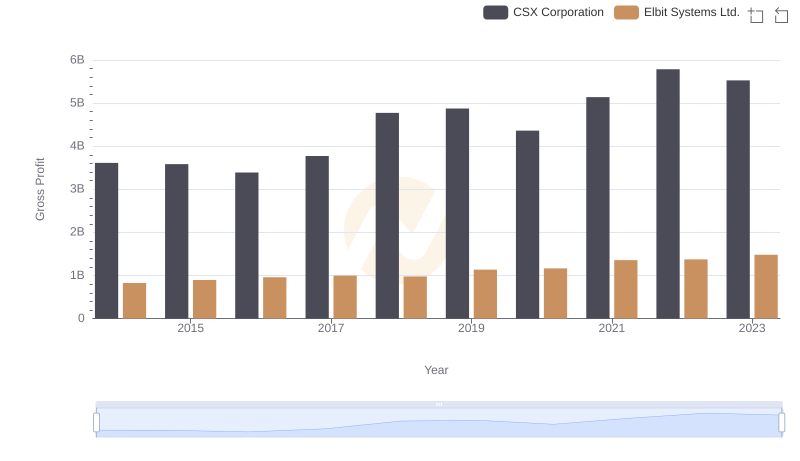
Gross Profit Trends Compared: CSX Corporation vs Elbit Systems Ltd.
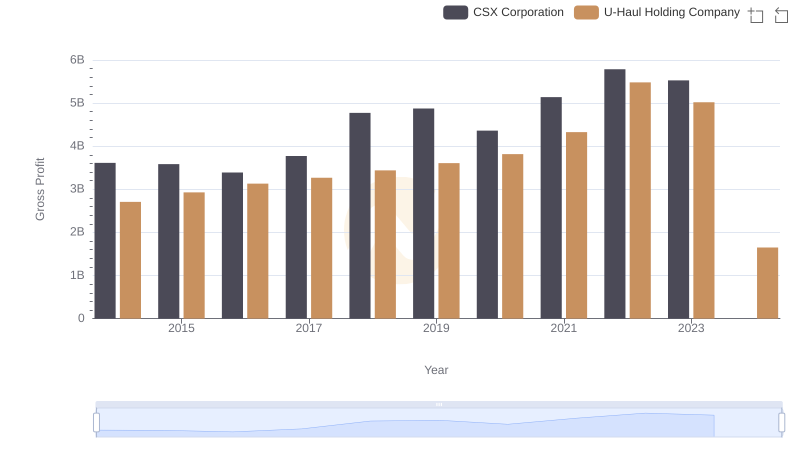
CSX Corporation vs U-Haul Holding Company: A Gross Profit Performance Breakdown