| __timestamp | 3M Company | Equifax Inc. |
|---|---|---|
| Wednesday, January 1, 2014 | 31821000000 | 2436400000 |
| Thursday, January 1, 2015 | 30274000000 | 2663600000 |
| Friday, January 1, 2016 | 30109000000 | 3144900000 |
| Sunday, January 1, 2017 | 31657000000 | 3362200000 |
| Monday, January 1, 2018 | 32765000000 | 3412100000 |
| Tuesday, January 1, 2019 | 32136000000 | 3507600000 |
| Wednesday, January 1, 2020 | 32184000000 | 4127500000 |
| Friday, January 1, 2021 | 35355000000 | 4923900000 |
| Saturday, January 1, 2022 | 34229000000 | 5122200000 |
| Sunday, January 1, 2023 | 32681000000 | 5265200000 |
| Monday, January 1, 2024 | 24575000000 | 5681100000 |
Igniting the spark of knowledge
In the ever-evolving landscape of American industry, 3M Company and Equifax Inc. stand as titans in their respective fields. From 2014 to 2023, 3M's revenue showcased a steady trajectory, peaking in 2021 with a remarkable 12% increase from 2014. However, 2024 data reveals a significant drop, indicating potential challenges ahead. Meanwhile, Equifax Inc. has demonstrated a robust growth pattern, with revenues more than doubling over the same period, reflecting a 116% increase. This growth underscores Equifax's strategic positioning in the data analytics sector. Notably, the absence of 2024 data for Equifax suggests a need for further analysis. As these companies navigate the complexities of their industries, their financial journeys offer valuable insights into market dynamics and strategic resilience.
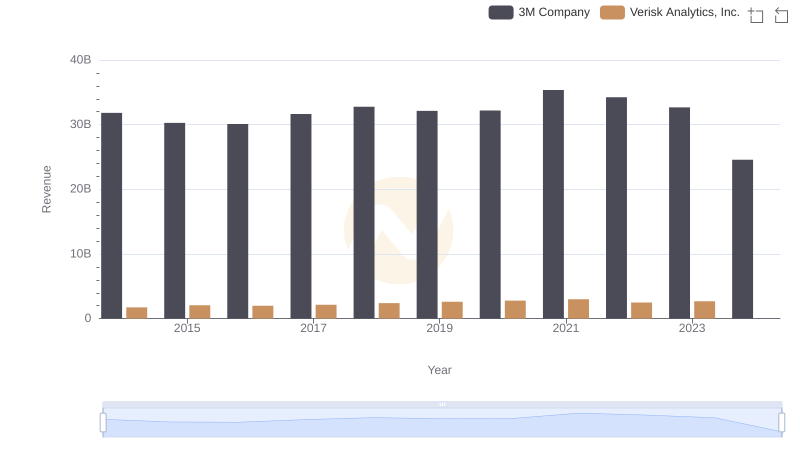
Annual Revenue Comparison: 3M Company vs Verisk Analytics, Inc.
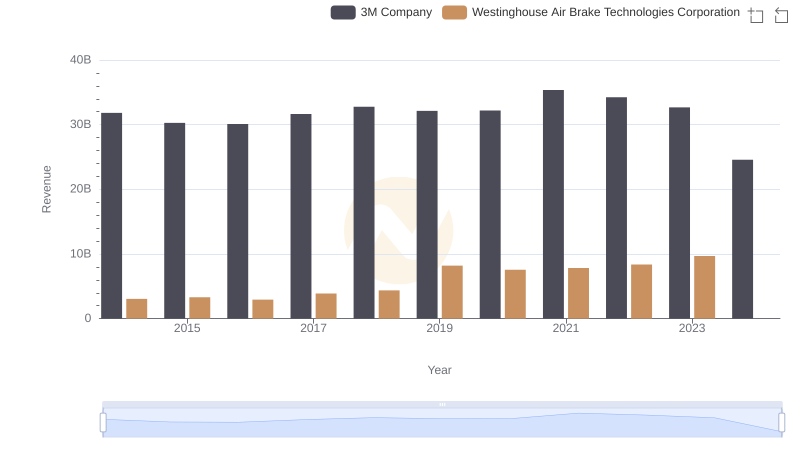
Who Generates More Revenue? 3M Company or Westinghouse Air Brake Technologies Corporation
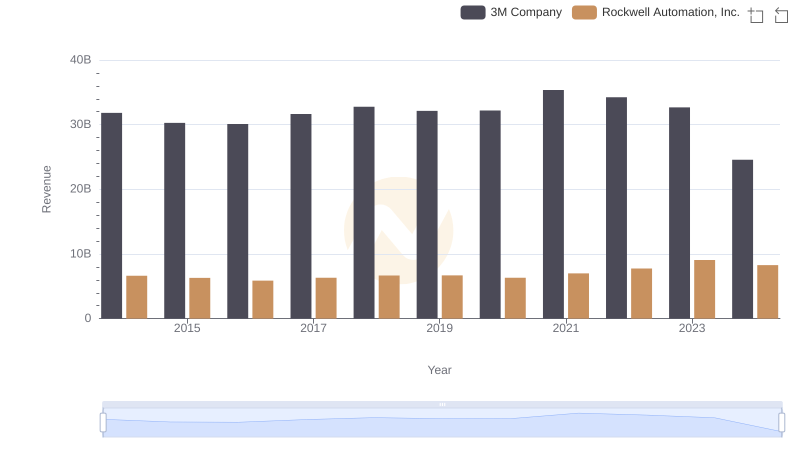
3M Company vs Rockwell Automation, Inc.: Examining Key Revenue Metrics
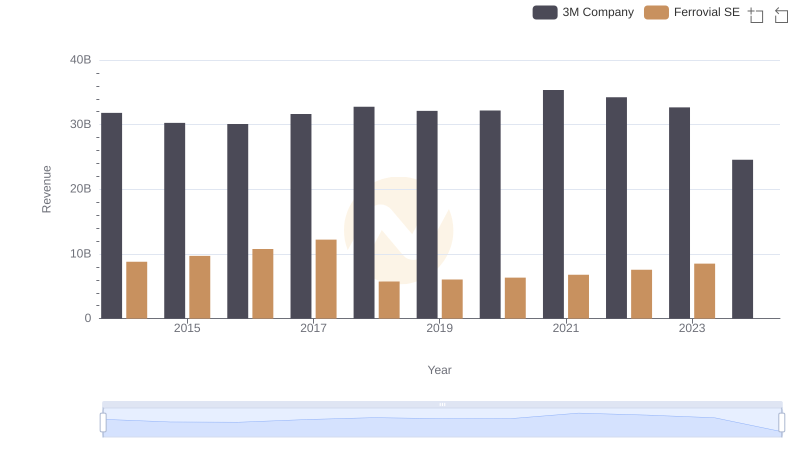
Comparing Revenue Performance: 3M Company or Ferrovial SE?
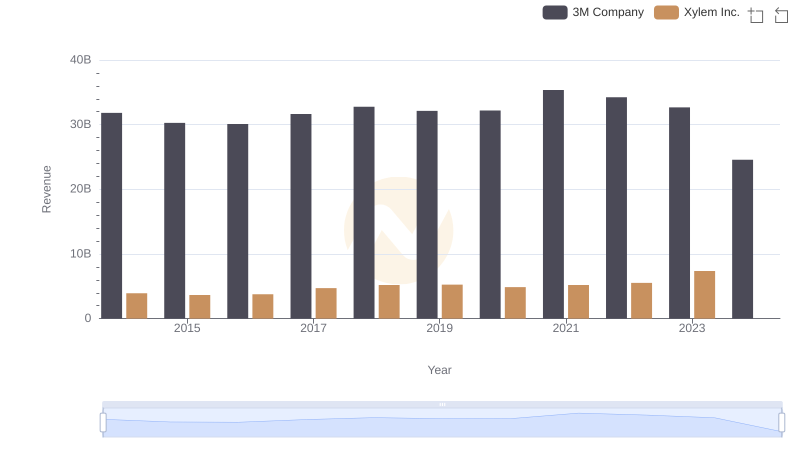
Annual Revenue Comparison: 3M Company vs Xylem Inc.
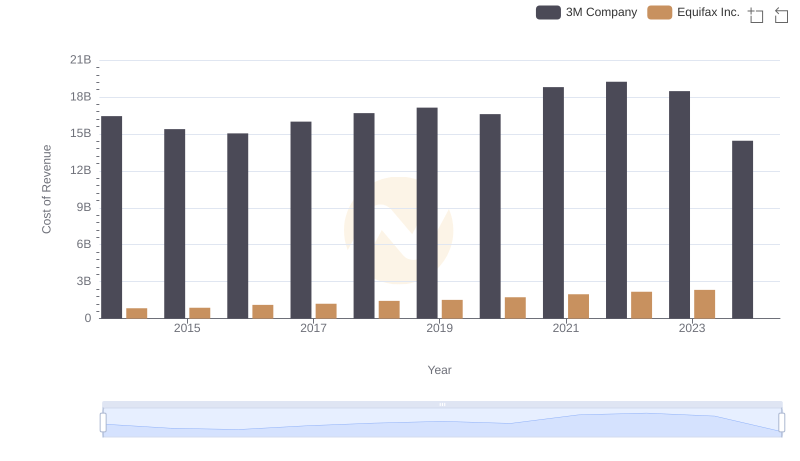
Cost of Revenue Comparison: 3M Company vs Equifax Inc.

Key Insights on Gross Profit: 3M Company vs Equifax Inc.
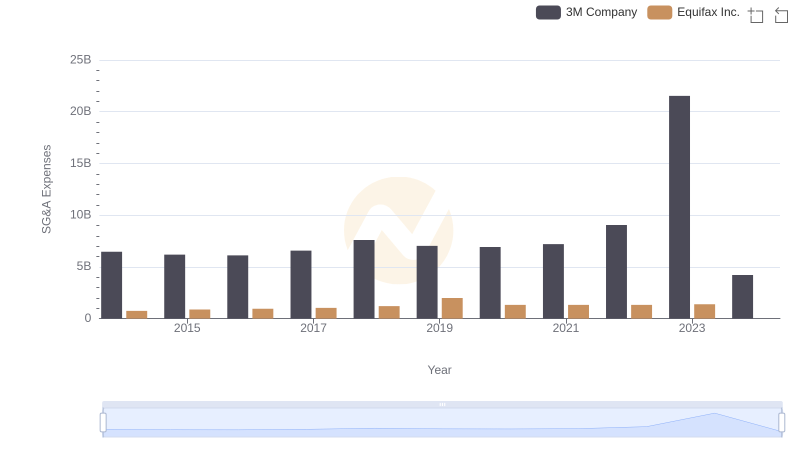
Comparing SG&A Expenses: 3M Company vs Equifax Inc. Trends and Insights