| __timestamp | 3M Company | Rockwell Automation, Inc. |
|---|---|---|
| Wednesday, January 1, 2014 | 31821000000 | 6623500000 |
| Thursday, January 1, 2015 | 30274000000 | 6307900000 |
| Friday, January 1, 2016 | 30109000000 | 5879500000 |
| Sunday, January 1, 2017 | 31657000000 | 6311300000 |
| Monday, January 1, 2018 | 32765000000 | 6666000000 |
| Tuesday, January 1, 2019 | 32136000000 | 6694800000 |
| Wednesday, January 1, 2020 | 32184000000 | 6329800000 |
| Friday, January 1, 2021 | 35355000000 | 6997400000 |
| Saturday, January 1, 2022 | 34229000000 | 7760400000 |
| Sunday, January 1, 2023 | 32681000000 | 9058000000 |
| Monday, January 1, 2024 | 24575000000 | 8264200000 |
Igniting the spark of knowledge
In the ever-evolving landscape of industrial innovation, 3M Company and Rockwell Automation, Inc. stand as titans. Over the past decade, these companies have showcased resilience and adaptability in their revenue streams. From 2014 to 2023, 3M's revenue fluctuated, peaking in 2021 with a 12% increase from 2016, before experiencing a notable dip in 2024. Meanwhile, Rockwell Automation, Inc. demonstrated a steady upward trajectory, culminating in a remarkable 54% growth by 2023 compared to 2016. This divergence highlights Rockwell's strategic advancements in automation technology, capturing market share in a rapidly digitizing world. As we look to the future, the contrasting revenue trends of these industry leaders offer a fascinating glimpse into the dynamics of industrial growth and innovation.
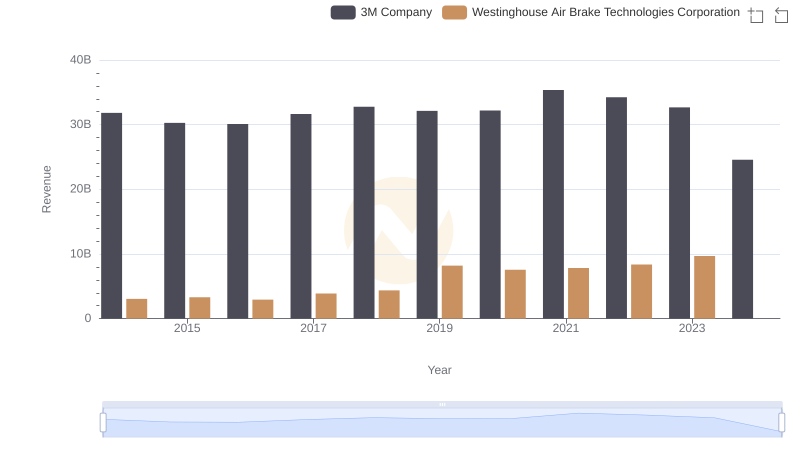
Who Generates More Revenue? 3M Company or Westinghouse Air Brake Technologies Corporation
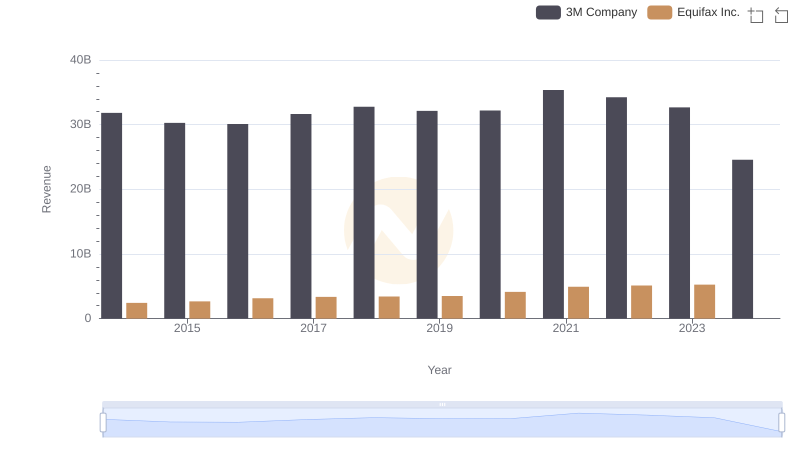
3M Company vs Equifax Inc.: Examining Key Revenue Metrics
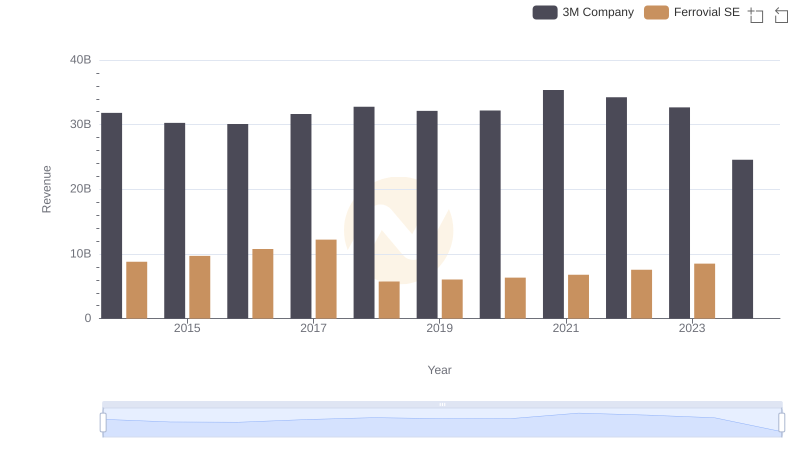
Comparing Revenue Performance: 3M Company or Ferrovial SE?
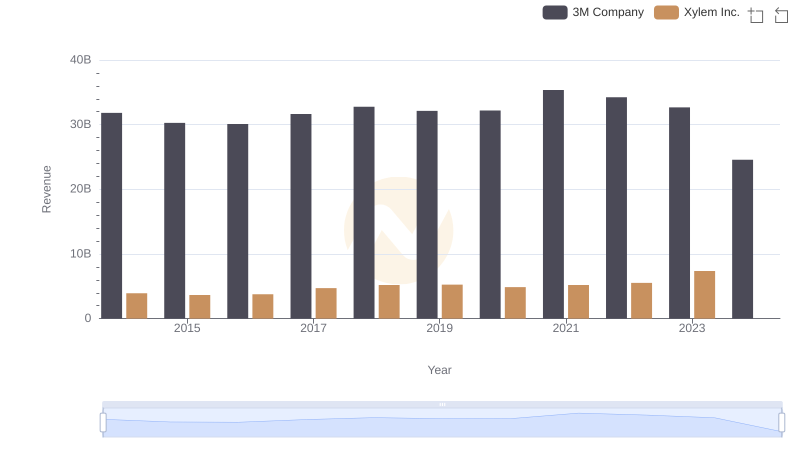
Annual Revenue Comparison: 3M Company vs Xylem Inc.
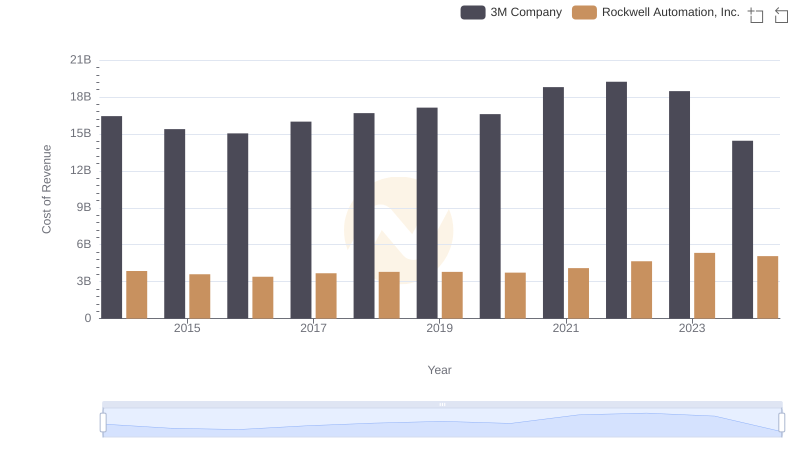
3M Company vs Rockwell Automation, Inc.: Efficiency in Cost of Revenue Explored
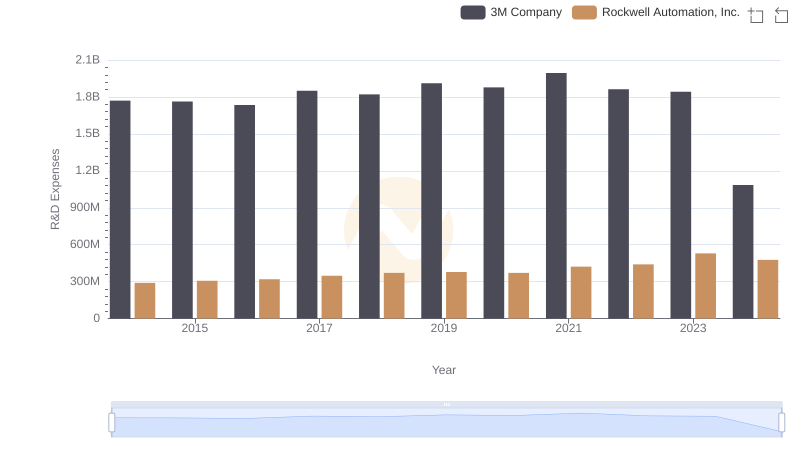
Research and Development Investment: 3M Company vs Rockwell Automation, Inc.