| __timestamp | 3M Company | Ferrovial SE |
|---|---|---|
| Wednesday, January 1, 2014 | 31821000000 | 8802000000 |
| Thursday, January 1, 2015 | 30274000000 | 9699000000 |
| Friday, January 1, 2016 | 30109000000 | 10758000000 |
| Sunday, January 1, 2017 | 31657000000 | 12209000000 |
| Monday, January 1, 2018 | 32765000000 | 5737000000 |
| Tuesday, January 1, 2019 | 32136000000 | 6054000000 |
| Wednesday, January 1, 2020 | 32184000000 | 6341000000 |
| Friday, January 1, 2021 | 35355000000 | 6778000000 |
| Saturday, January 1, 2022 | 34229000000 | 7551000000 |
| Sunday, January 1, 2023 | 32681000000 | 8514000000 |
| Monday, January 1, 2024 | 24575000000 |
In pursuit of knowledge
In the ever-evolving landscape of global business, revenue performance is a key indicator of a company's success. This analysis delves into the annual revenue trends of two industry giants: 3M Company and Ferrovial SE, from 2014 to 2023.
3M Company, a stalwart in the industrial sector, consistently outperformed Ferrovial SE, a leader in infrastructure, with revenues averaging around 31.6 billion USD annually. Despite a slight dip in 2015, 3M's revenue peaked in 2021, showcasing a robust 11% growth from 2014. In contrast, Ferrovial SE's revenue, averaging 8.2 billion USD, experienced more volatility, with a notable peak in 2017.
While 2024 data for Ferrovial SE is unavailable, the trends suggest a potential for growth. As these companies navigate future challenges, their revenue trajectories will be crucial for investors and stakeholders alike.
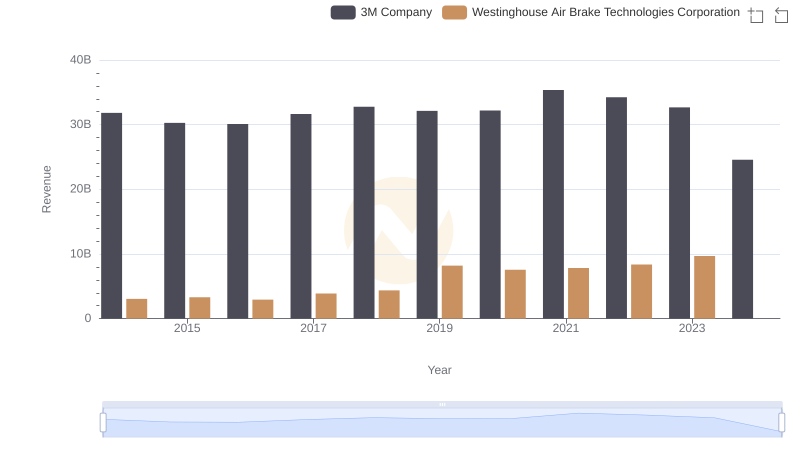
Who Generates More Revenue? 3M Company or Westinghouse Air Brake Technologies Corporation
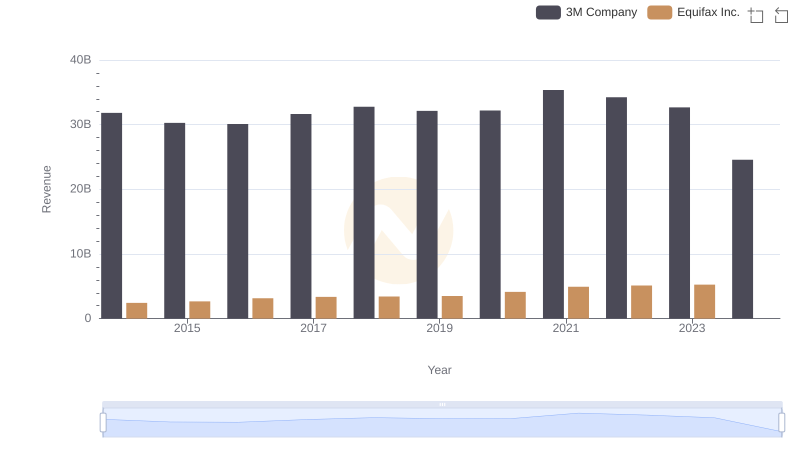
3M Company vs Equifax Inc.: Examining Key Revenue Metrics
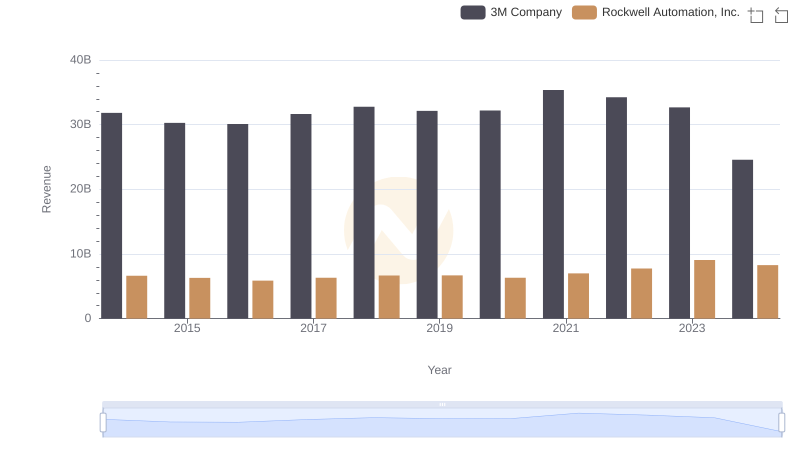
3M Company vs Rockwell Automation, Inc.: Examining Key Revenue Metrics
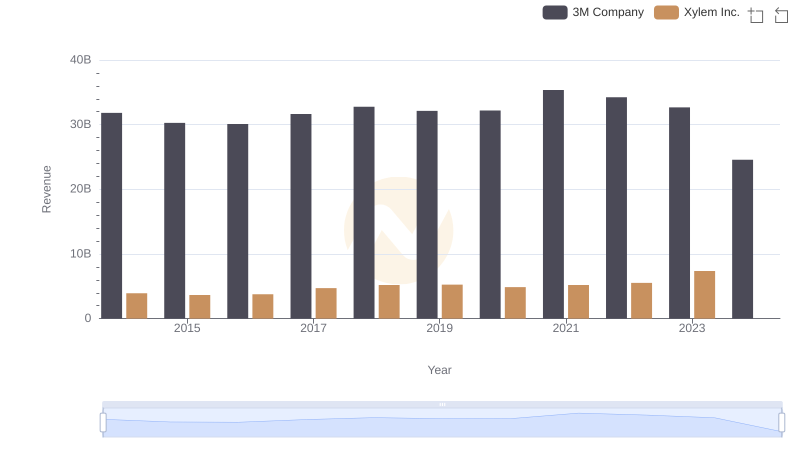
Annual Revenue Comparison: 3M Company vs Xylem Inc.
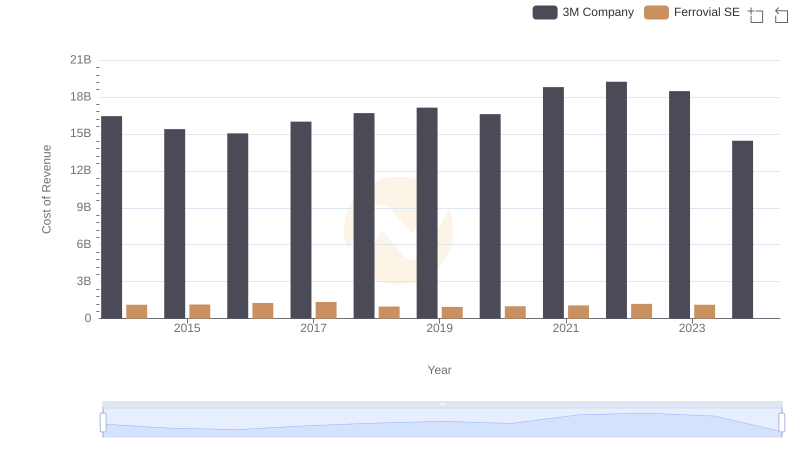
Cost of Revenue Trends: 3M Company vs Ferrovial SE
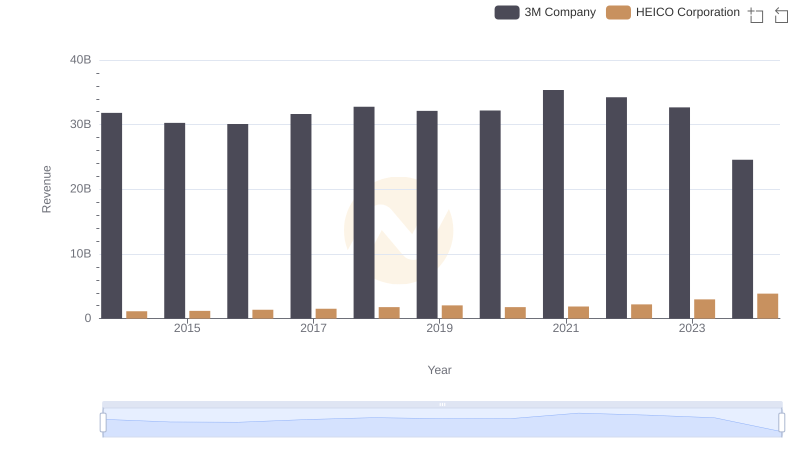
3M Company vs HEICO Corporation: Examining Key Revenue Metrics
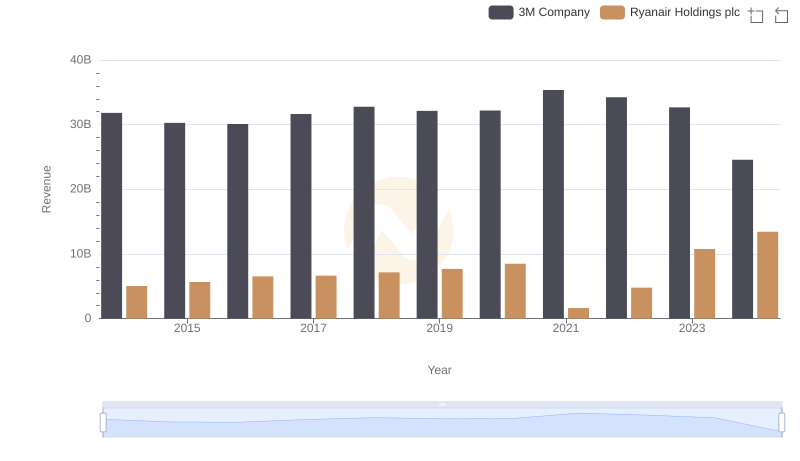
Breaking Down Revenue Trends: 3M Company vs Ryanair Holdings plc