| __timestamp | 3M Company | Xylem Inc. |
|---|---|---|
| Wednesday, January 1, 2014 | 31821000000 | 3916000000 |
| Thursday, January 1, 2015 | 30274000000 | 3653000000 |
| Friday, January 1, 2016 | 30109000000 | 3771000000 |
| Sunday, January 1, 2017 | 31657000000 | 4707000000 |
| Monday, January 1, 2018 | 32765000000 | 5207000000 |
| Tuesday, January 1, 2019 | 32136000000 | 5249000000 |
| Wednesday, January 1, 2020 | 32184000000 | 4876000000 |
| Friday, January 1, 2021 | 35355000000 | 5195000000 |
| Saturday, January 1, 2022 | 34229000000 | 5522000000 |
| Sunday, January 1, 2023 | 32681000000 | 7364000000 |
| Monday, January 1, 2024 | 24575000000 |
Infusing magic into the data realm
In the ever-evolving landscape of industrial innovation, 3M Company and Xylem Inc. stand as titans, each carving its niche in the global market. Over the past decade, 3M has consistently demonstrated its prowess, with annual revenues peaking at approximately $35 billion in 2021. However, recent trends indicate a slight decline, with 2023 revenues dropping to around $33 billion, a 6% decrease from its peak.
Conversely, Xylem Inc., a leader in water technology, has shown remarkable growth. From 2014 to 2023, Xylem's revenue surged by nearly 88%, reaching over $7 billion in 2023. This growth underscores the increasing global emphasis on sustainable water solutions.
While 3M's revenue trajectory shows signs of stabilization, Xylem's upward trend highlights its expanding influence in the water sector. The data for 2024 remains incomplete, leaving room for speculation on future market dynamics.
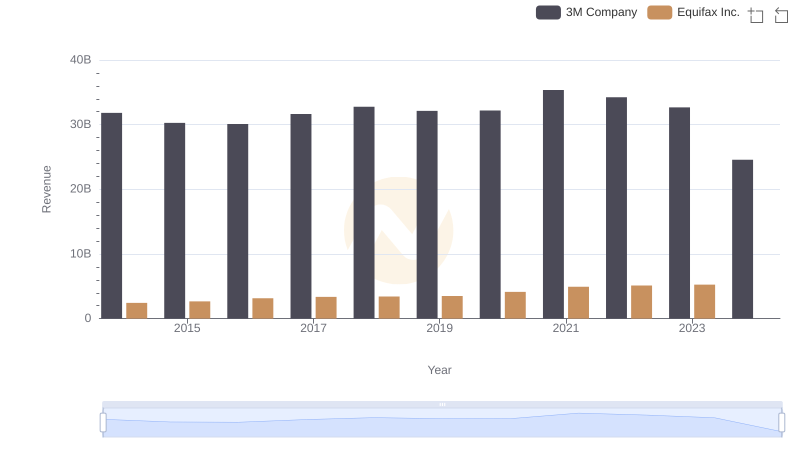
3M Company vs Equifax Inc.: Examining Key Revenue Metrics
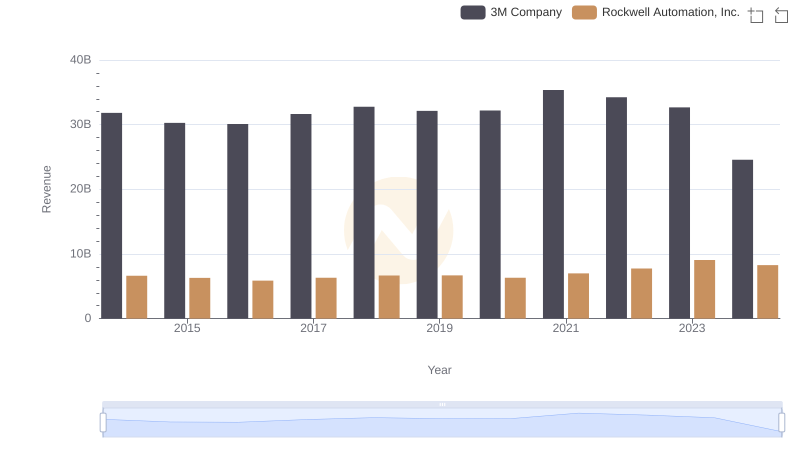
3M Company vs Rockwell Automation, Inc.: Examining Key Revenue Metrics
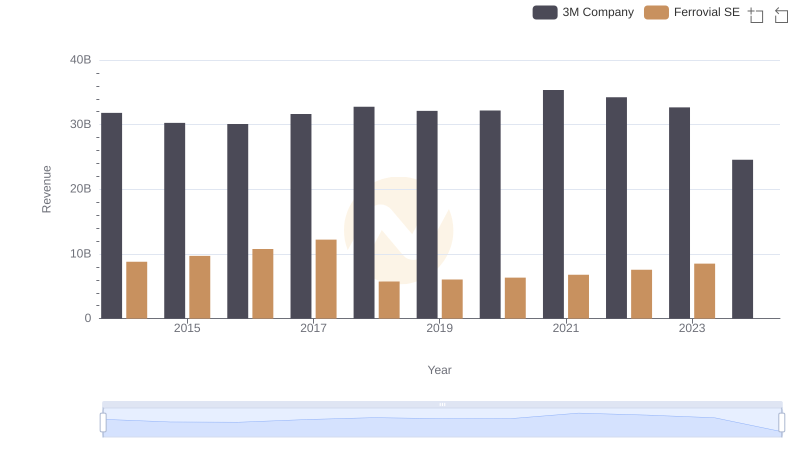
Comparing Revenue Performance: 3M Company or Ferrovial SE?
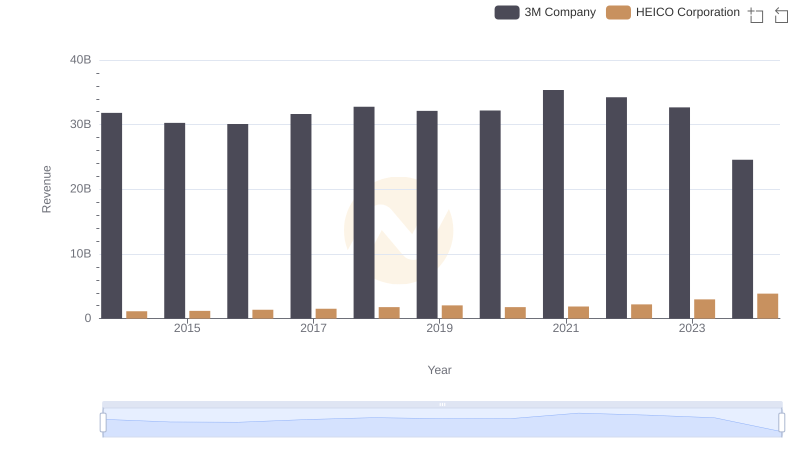
3M Company vs HEICO Corporation: Examining Key Revenue Metrics
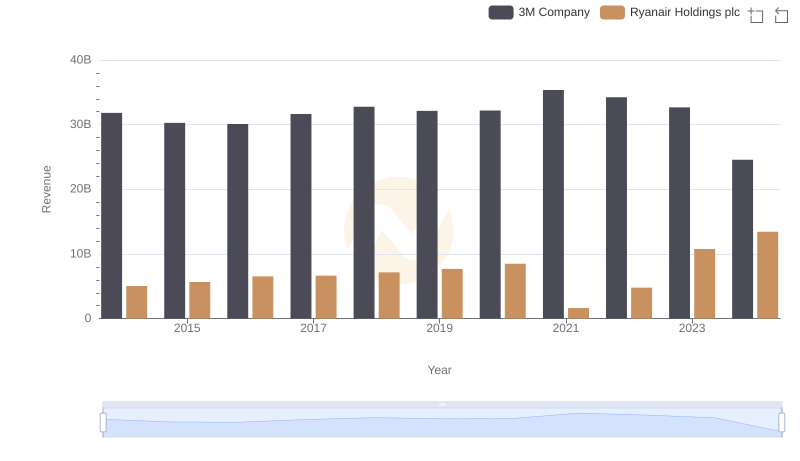
Breaking Down Revenue Trends: 3M Company vs Ryanair Holdings plc
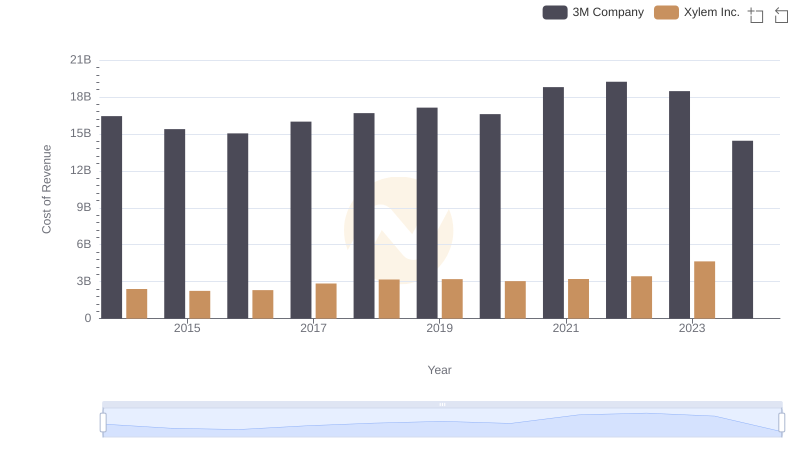
3M Company vs Xylem Inc.: Efficiency in Cost of Revenue Explored
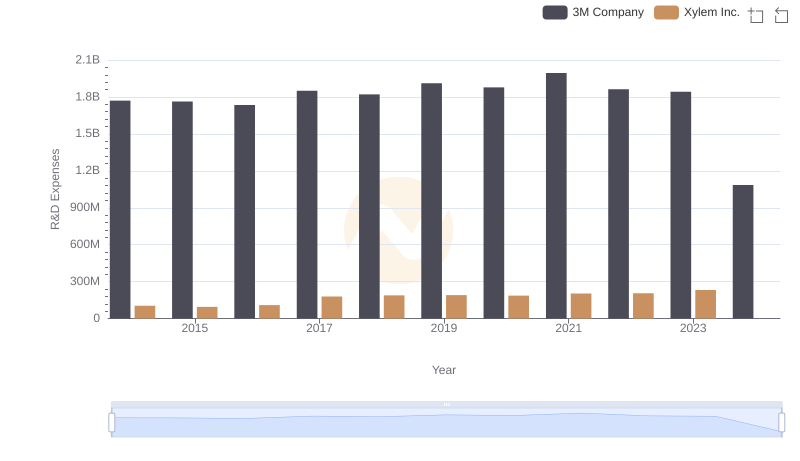
R&D Insights: How 3M Company and Xylem Inc. Allocate Funds