| __timestamp | 3M Company | Equifax Inc. |
|---|---|---|
| Wednesday, January 1, 2014 | 15374000000 | 1591700000 |
| Thursday, January 1, 2015 | 14891000000 | 1776200000 |
| Friday, January 1, 2016 | 15069000000 | 2031500000 |
| Sunday, January 1, 2017 | 15656000000 | 2151500000 |
| Monday, January 1, 2018 | 16083000000 | 1971700000 |
| Tuesday, January 1, 2019 | 15000000000 | 1985900000 |
| Wednesday, January 1, 2020 | 15579000000 | 2390100000 |
| Friday, January 1, 2021 | 16560000000 | 2943000000 |
| Saturday, January 1, 2022 | 14997000000 | 2945000000 |
| Sunday, January 1, 2023 | 14204000000 | 2930100000 |
| Monday, January 1, 2024 | 10128000000 | 5681100000 |
Data in motion
In the world of corporate finance, gross profit is a key indicator of a company's financial health. Over the past decade, 3M Company and Equifax Inc. have showcased contrasting trajectories in their gross profit margins. From 2014 to 2023, 3M Company consistently maintained a robust gross profit, peaking in 2021 with a 7% increase from 2014. However, a notable decline of approximately 14% was observed by 2023. In contrast, Equifax Inc. demonstrated a steady upward trend, with a remarkable 85% growth in gross profit from 2014 to 2023, despite missing data for 2024. This divergence highlights the dynamic nature of the market and the varying strategies employed by these industry leaders. As we look to the future, the financial strategies of these companies will be pivotal in shaping their continued success.
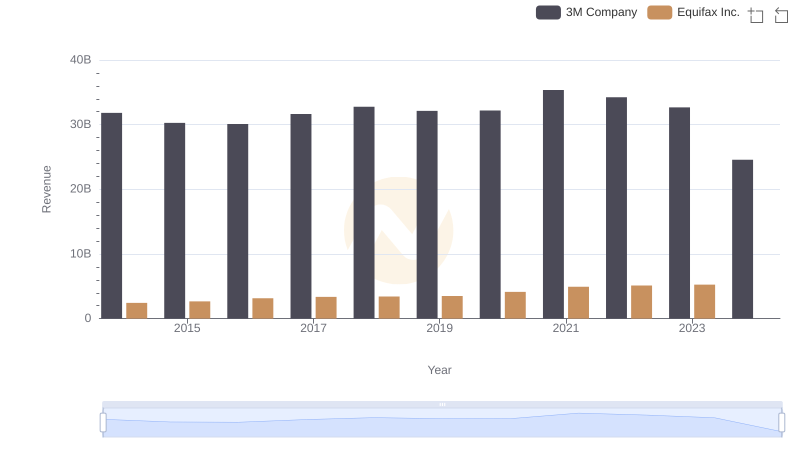
3M Company vs Equifax Inc.: Examining Key Revenue Metrics
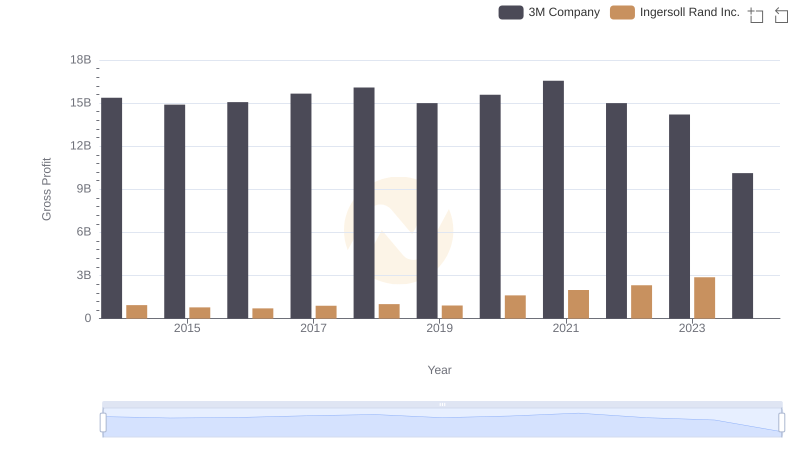
Gross Profit Comparison: 3M Company and Ingersoll Rand Inc. Trends
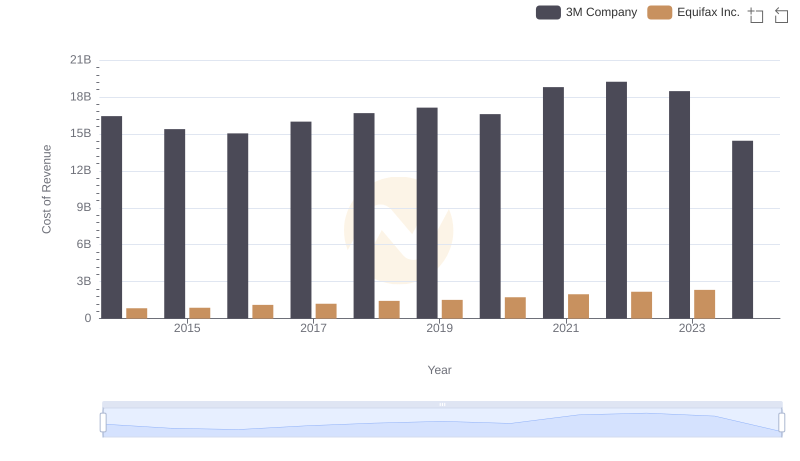
Cost of Revenue Comparison: 3M Company vs Equifax Inc.
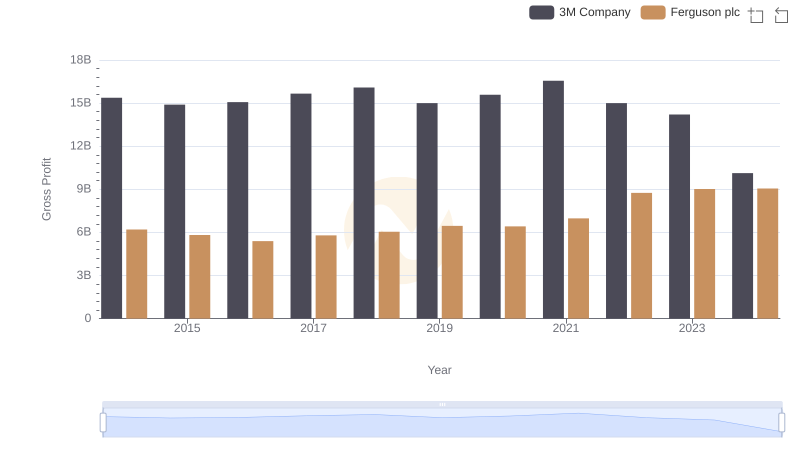
Gross Profit Trends Compared: 3M Company vs Ferguson plc
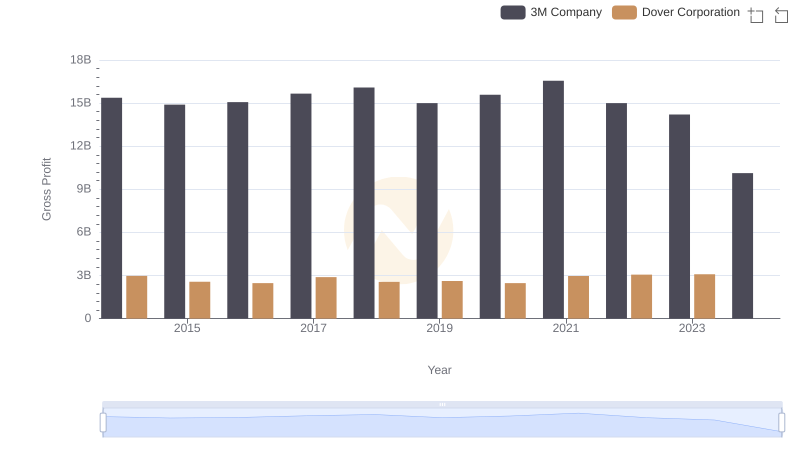
Gross Profit Comparison: 3M Company and Dover Corporation Trends
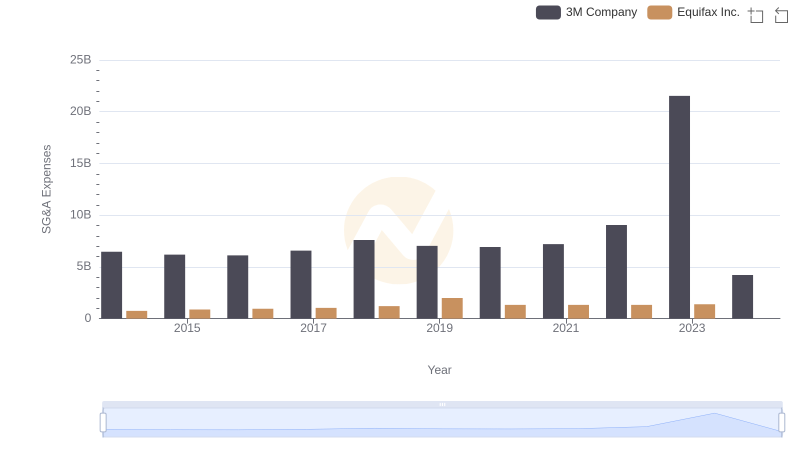
Comparing SG&A Expenses: 3M Company vs Equifax Inc. Trends and Insights
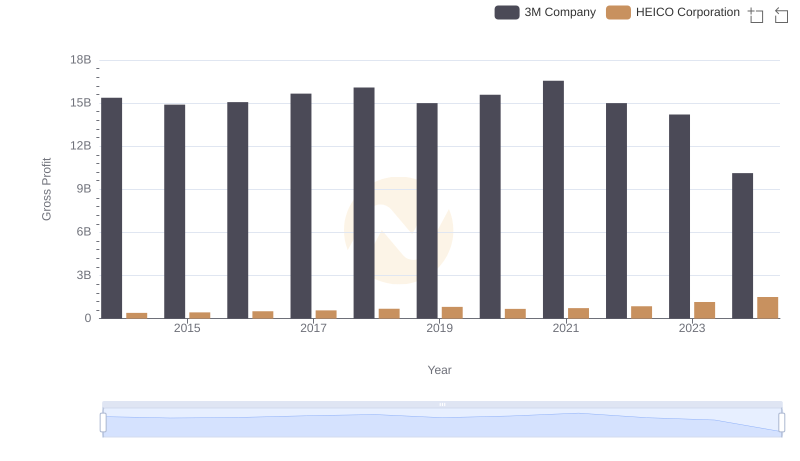
Key Insights on Gross Profit: 3M Company vs HEICO Corporation