| __timestamp | 3M Company | Verisk Analytics, Inc. |
|---|---|---|
| Wednesday, January 1, 2014 | 31821000000 | 1746726000 |
| Thursday, January 1, 2015 | 30274000000 | 2068010000 |
| Friday, January 1, 2016 | 30109000000 | 1995200000 |
| Sunday, January 1, 2017 | 31657000000 | 2145200000 |
| Monday, January 1, 2018 | 32765000000 | 2395100000 |
| Tuesday, January 1, 2019 | 32136000000 | 2607100000 |
| Wednesday, January 1, 2020 | 32184000000 | 2784600000 |
| Friday, January 1, 2021 | 35355000000 | 2998600000 |
| Saturday, January 1, 2022 | 34229000000 | 2497000000 |
| Sunday, January 1, 2023 | 32681000000 | 2681400000 |
| Monday, January 1, 2024 | 24575000000 |
Unveiling the hidden dimensions of data
In the ever-evolving landscape of American industry, the financial trajectories of 3M Company and Verisk Analytics, Inc. offer a fascinating study in contrasts. Over the past decade, 3M Company, a stalwart in manufacturing and consumer goods, has consistently outpaced Verisk Analytics, Inc., a leader in data analytics, in terms of annual revenue. From 2014 to 2023, 3M's revenue has shown a robust average of approximately $31.6 billion, peaking in 2021 with a 12% increase from 2015. In contrast, Verisk Analytics, Inc. has experienced a steady climb, with revenues growing by about 54% over the same period, reaching nearly $3 billion in 2021. However, the data for 2024 is incomplete, leaving room for speculation on future trends. This comparison not only highlights the resilience of traditional manufacturing but also underscores the growing importance of data analytics in the modern economy.
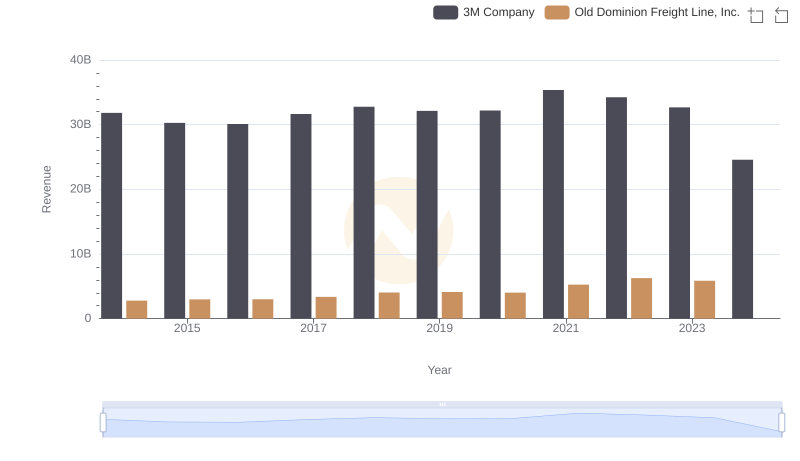
3M Company vs Old Dominion Freight Line, Inc.: Annual Revenue Growth Compared
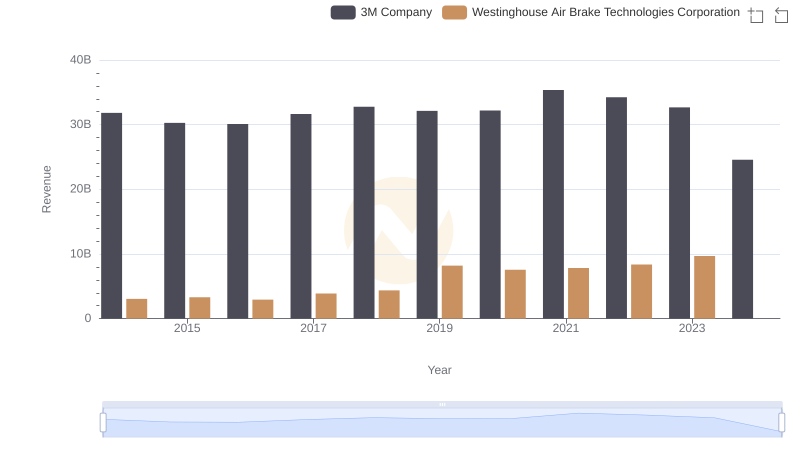
Who Generates More Revenue? 3M Company or Westinghouse Air Brake Technologies Corporation
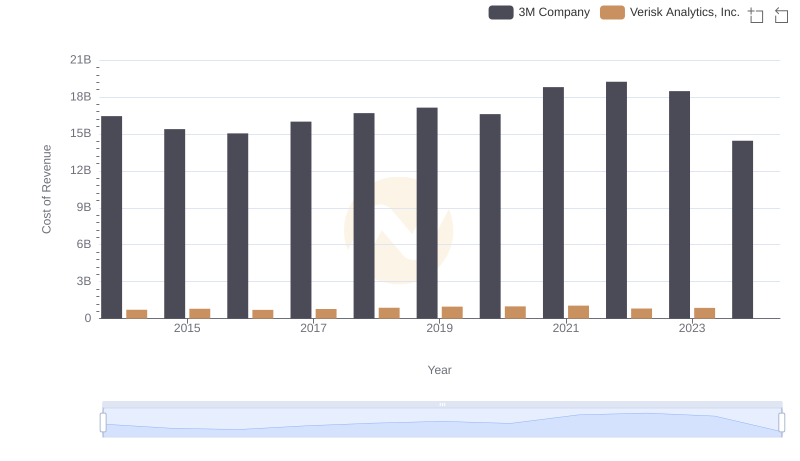
Cost Insights: Breaking Down 3M Company and Verisk Analytics, Inc.'s Expenses
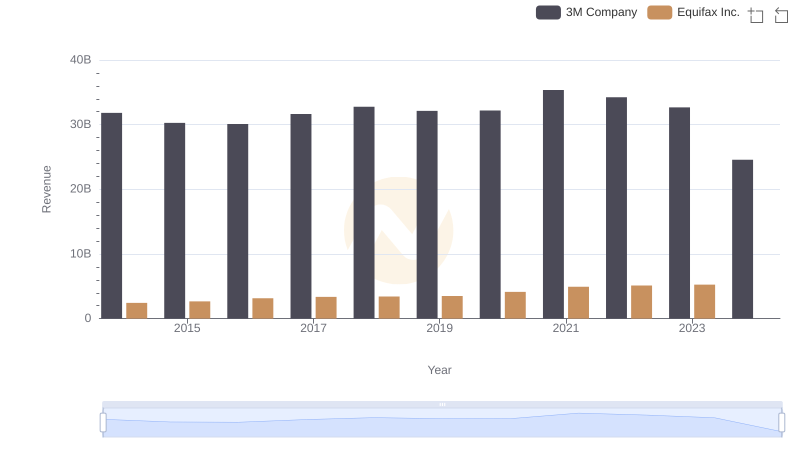
3M Company vs Equifax Inc.: Examining Key Revenue Metrics
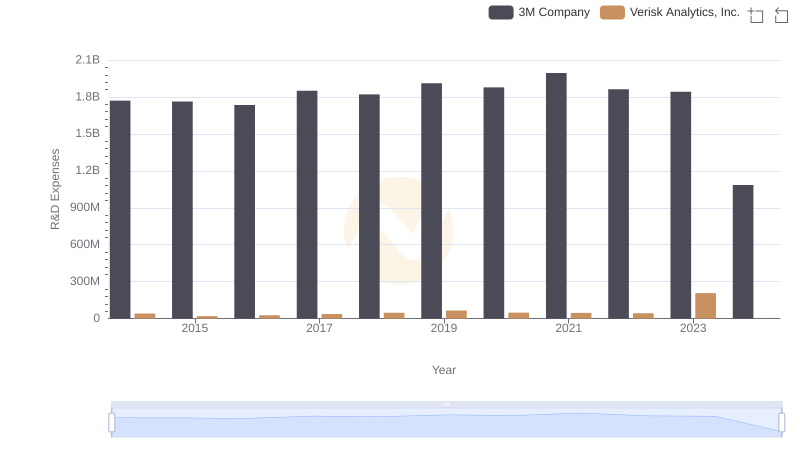
Research and Development Expenses Breakdown: 3M Company vs Verisk Analytics, Inc.
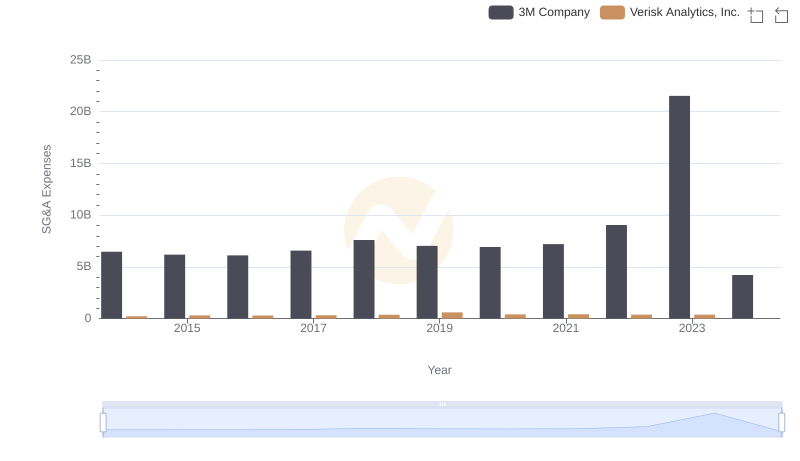
Selling, General, and Administrative Costs: 3M Company vs Verisk Analytics, Inc.