| __timestamp | 3M Company | EMCOR Group, Inc. |
|---|---|---|
| Wednesday, January 1, 2014 | 6469000000 | 626478000 |
| Thursday, January 1, 2015 | 6182000000 | 656573000 |
| Friday, January 1, 2016 | 6111000000 | 725538000 |
| Sunday, January 1, 2017 | 6572000000 | 757062000 |
| Monday, January 1, 2018 | 7602000000 | 799157000 |
| Tuesday, January 1, 2019 | 7029000000 | 893453000 |
| Wednesday, January 1, 2020 | 6929000000 | 903584000 |
| Friday, January 1, 2021 | 7197000000 | 970937000 |
| Saturday, January 1, 2022 | 9049000000 | 1038717000 |
| Sunday, January 1, 2023 | 21526000000 | 1211233000 |
| Monday, January 1, 2024 | 4221000000 |
Data in motion
In the competitive landscape of corporate America, managing Selling, General, and Administrative (SG&A) expenses is crucial for profitability. This analysis compares the SG&A cost optimization strategies of 3M Company and EMCOR Group, Inc. from 2014 to 2023. Over this period, 3M's SG&A expenses fluctuated significantly, peaking in 2023 with a staggering 166% increase from 2014. In contrast, EMCOR Group, Inc. demonstrated a more consistent approach, with a steady rise of approximately 93% over the same period.
While 3M's expenses surged in 2023, EMCOR maintained a more stable trajectory, suggesting a potentially more efficient cost management strategy. However, the data for 2024 is incomplete, leaving room for speculation on future trends. This comparison highlights the importance of strategic SG&A management in maintaining competitive advantage and financial health.
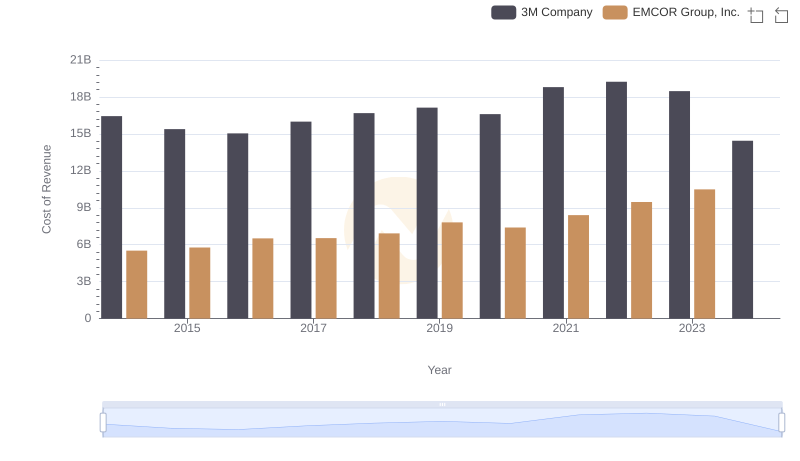
3M Company vs EMCOR Group, Inc.: Efficiency in Cost of Revenue Explored
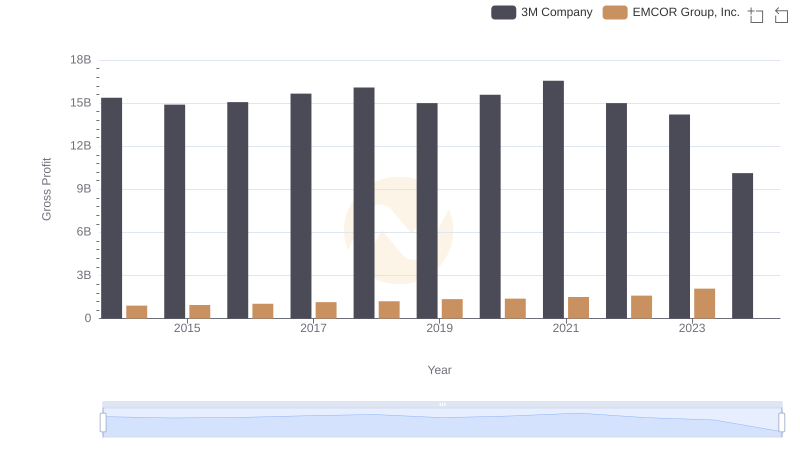
Who Generates Higher Gross Profit? 3M Company or EMCOR Group, Inc.

SG&A Efficiency Analysis: Comparing 3M Company and Hubbell Incorporated
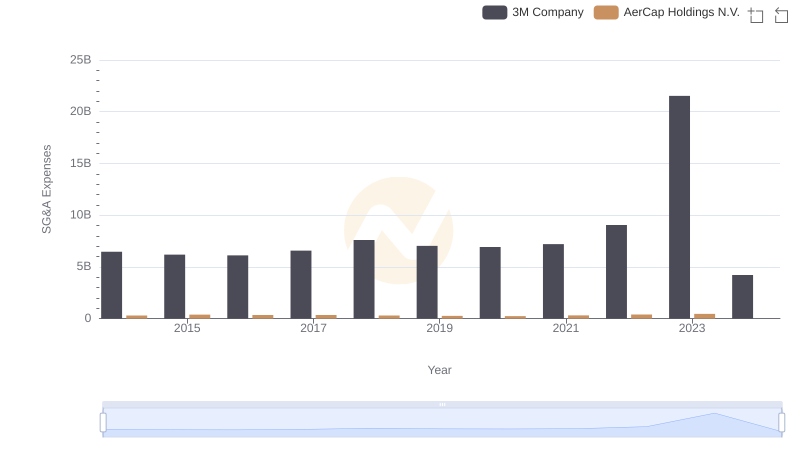
Who Optimizes SG&A Costs Better? 3M Company or AerCap Holdings N.V.
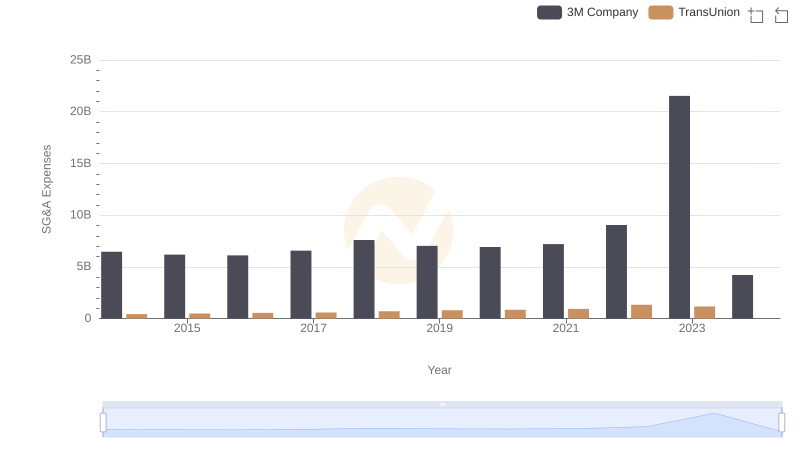
3M Company vs TransUnion: SG&A Expense Trends

3M Company and Lennox International Inc.: SG&A Spending Patterns Compared