| __timestamp | 3M Company | AerCap Holdings N.V. |
|---|---|---|
| Wednesday, January 1, 2014 | 6469000000 | 299900000 |
| Thursday, January 1, 2015 | 6182000000 | 381308000 |
| Friday, January 1, 2016 | 6111000000 | 351012000 |
| Sunday, January 1, 2017 | 6572000000 | 348291000 |
| Monday, January 1, 2018 | 7602000000 | 305226000 |
| Tuesday, January 1, 2019 | 7029000000 | 267458000 |
| Wednesday, January 1, 2020 | 6929000000 | 242161000 |
| Friday, January 1, 2021 | 7197000000 | 317888000 |
| Saturday, January 1, 2022 | 9049000000 | 399530000 |
| Sunday, January 1, 2023 | 21526000000 | 464128000 |
| Monday, January 1, 2024 | 4221000000 |
Igniting the spark of knowledge
In the competitive world of corporate finance, managing Selling, General, and Administrative (SG&A) expenses is crucial for profitability. This analysis compares the SG&A cost optimization strategies of 3M Company and AerCap Holdings N.V. over the past decade.
From 2014 to 2023, 3M Company consistently reported higher SG&A expenses, peaking in 2023 with a staggering 21.5 billion dollars. Despite this, 3M's expenses showed a downward trend of approximately 28% from 2014 to 2020, indicating effective cost management strategies. In contrast, AerCap Holdings N.V. maintained a more stable SG&A expense profile, averaging around 337 million dollars annually, with a slight increase of 55% from 2014 to 2023.
While 3M's expenses are significantly higher, their ability to reduce costs over time suggests a robust optimization strategy. AerCap's steady expenses reflect a different approach, focusing on maintaining consistent cost levels.
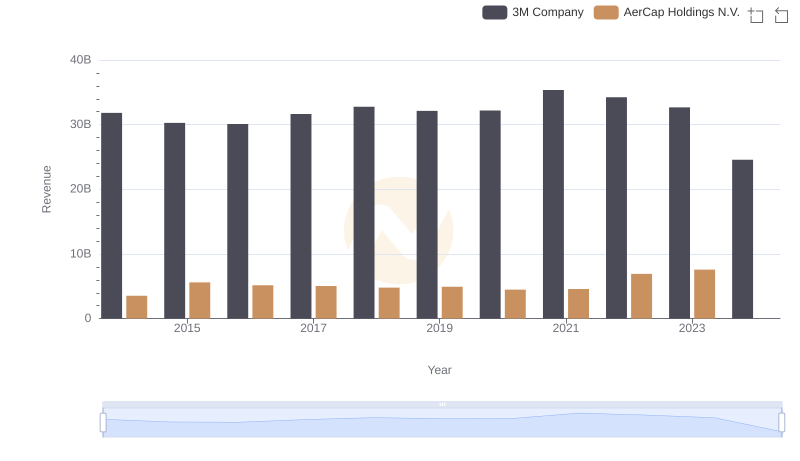
Annual Revenue Comparison: 3M Company vs AerCap Holdings N.V.
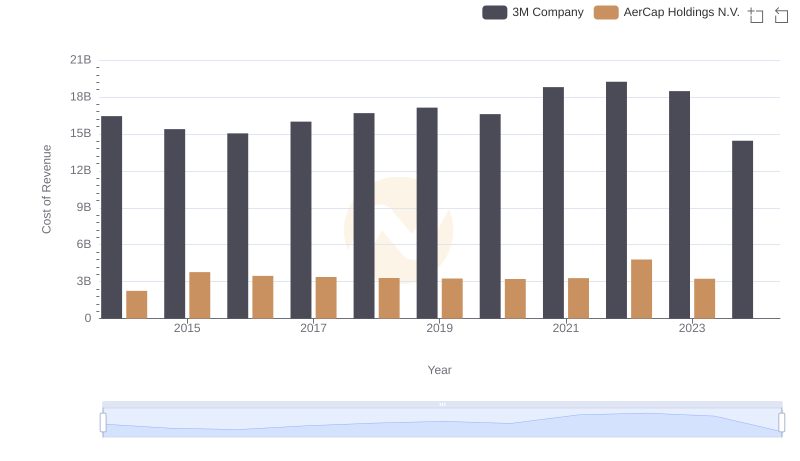
3M Company vs AerCap Holdings N.V.: Efficiency in Cost of Revenue Explored

SG&A Efficiency Analysis: Comparing 3M Company and Hubbell Incorporated
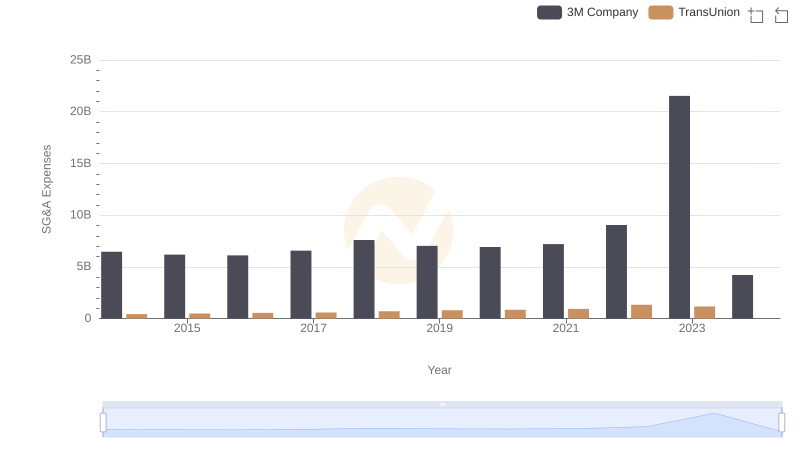
3M Company vs TransUnion: SG&A Expense Trends
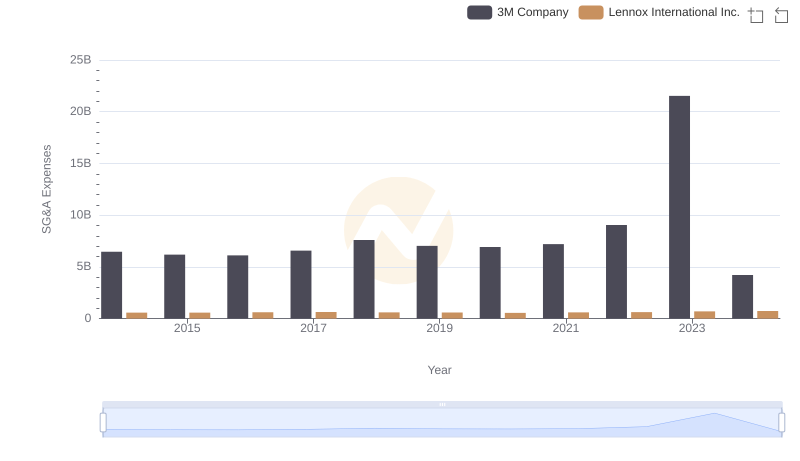
3M Company and Lennox International Inc.: SG&A Spending Patterns Compared

Who Optimizes SG&A Costs Better? 3M Company or EMCOR Group, Inc.