| __timestamp | 3M Company | AerCap Holdings N.V. |
|---|---|---|
| Wednesday, January 1, 2014 | 31821000000 | 3535797000 |
| Thursday, January 1, 2015 | 30274000000 | 5598662000 |
| Friday, January 1, 2016 | 30109000000 | 5152131000 |
| Sunday, January 1, 2017 | 31657000000 | 5037493000 |
| Monday, January 1, 2018 | 32765000000 | 4799980000 |
| Tuesday, January 1, 2019 | 32136000000 | 4937340000 |
| Wednesday, January 1, 2020 | 32184000000 | 4493629000 |
| Friday, January 1, 2021 | 35355000000 | 4588930000 |
| Saturday, January 1, 2022 | 34229000000 | 6914985000 |
| Sunday, January 1, 2023 | 32681000000 | 7574664000 |
| Monday, January 1, 2024 | 24575000000 |
Data in motion
In the ever-evolving landscape of global business, the financial trajectories of 3M Company and AerCap Holdings N.V. offer a fascinating study. Over the past decade, 3M has consistently demonstrated robust revenue figures, peaking in 2021 with a 12% increase from 2014. However, 2024 shows a notable dip, indicating potential challenges or strategic shifts.
Conversely, AerCap Holdings N.V. has shown remarkable growth, with revenues more than doubling from 2014 to 2023, reflecting a dynamic expansion strategy. The year 2022 marked a significant leap, with a 50% increase compared to 2020, showcasing resilience amidst global economic fluctuations.
While 3M's revenue trend appears to be stabilizing, AerCap's upward trajectory suggests a promising future. Missing data for 2024 for AerCap hints at potential updates or strategic changes yet to be revealed. Stay tuned as these industry titans continue to shape the market landscape.
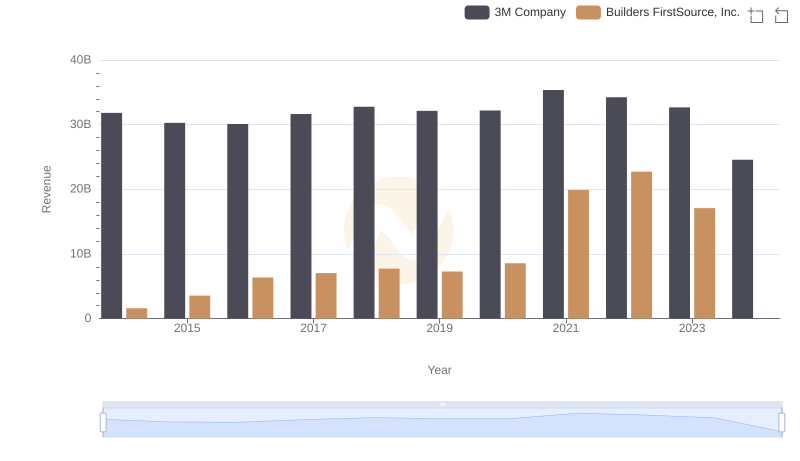
Breaking Down Revenue Trends: 3M Company vs Builders FirstSource, Inc.
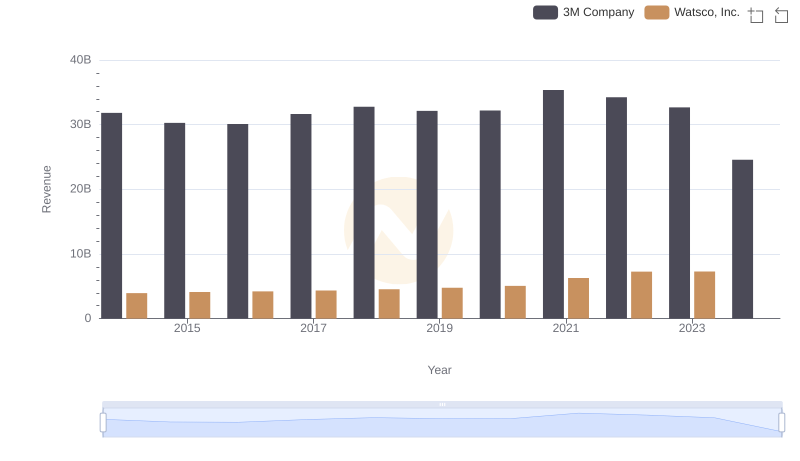
3M Company and Watsco, Inc.: A Comprehensive Revenue Analysis
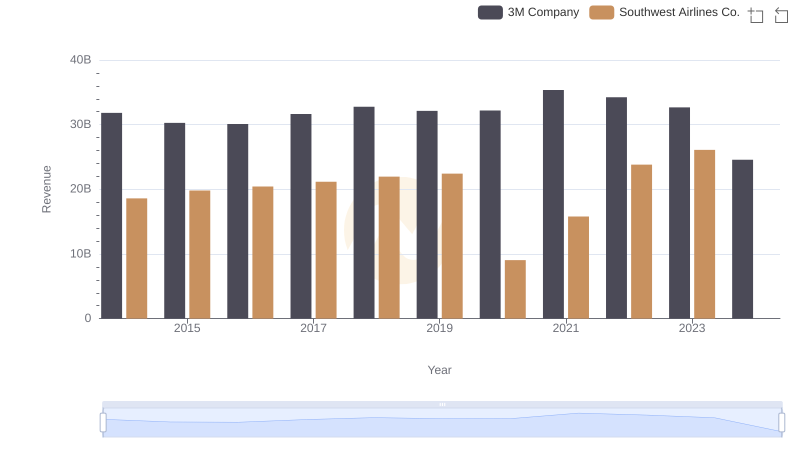
Revenue Showdown: 3M Company vs Southwest Airlines Co.
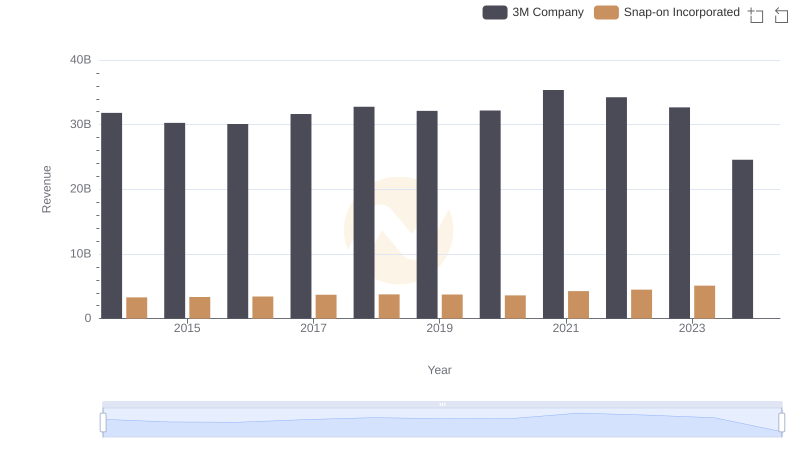
Revenue Showdown: 3M Company vs Snap-on Incorporated
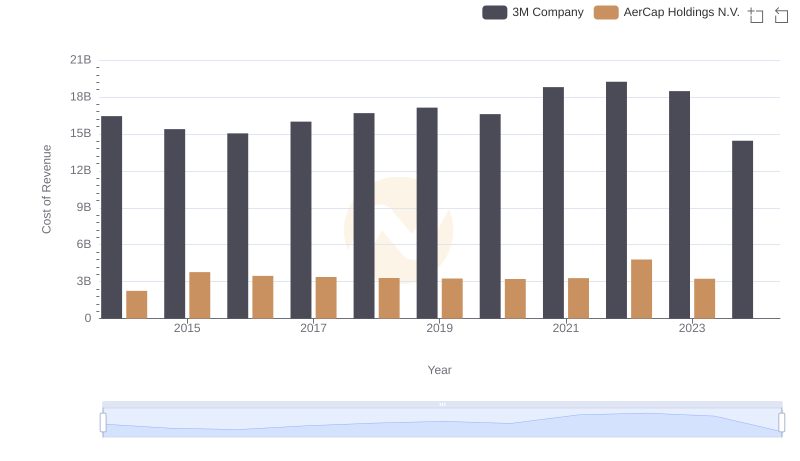
3M Company vs AerCap Holdings N.V.: Efficiency in Cost of Revenue Explored
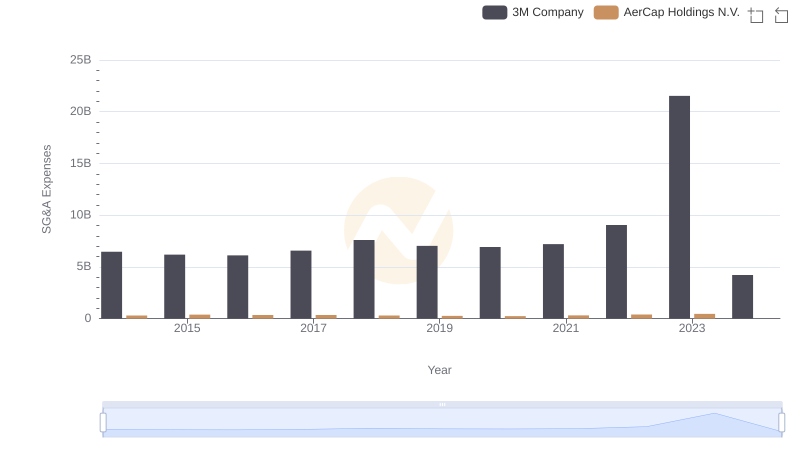
Who Optimizes SG&A Costs Better? 3M Company or AerCap Holdings N.V.