| __timestamp | 3M Company | Lennox International Inc. |
|---|---|---|
| Wednesday, January 1, 2014 | 6469000000 | 573700000 |
| Thursday, January 1, 2015 | 6182000000 | 580500000 |
| Friday, January 1, 2016 | 6111000000 | 621000000 |
| Sunday, January 1, 2017 | 6572000000 | 637700000 |
| Monday, January 1, 2018 | 7602000000 | 608200000 |
| Tuesday, January 1, 2019 | 7029000000 | 585900000 |
| Wednesday, January 1, 2020 | 6929000000 | 555900000 |
| Friday, January 1, 2021 | 7197000000 | 598900000 |
| Saturday, January 1, 2022 | 9049000000 | 627200000 |
| Sunday, January 1, 2023 | 21526000000 | 705500000 |
| Monday, January 1, 2024 | 4221000000 | 730600000 |
Igniting the spark of knowledge
In the world of corporate finance, understanding a company's spending patterns can reveal much about its strategic priorities. Over the past decade, 3M Company and Lennox International Inc. have showcased distinct trends in their Selling, General, and Administrative (SG&A) expenses.
3M Company, a global conglomerate, has seen its SG&A expenses fluctuate significantly, peaking in 2023 with a staggering 166% increase compared to 2014. This surge could indicate strategic investments in marketing and administration to bolster its market position. Conversely, Lennox International Inc., a leader in climate control solutions, has maintained a more stable SG&A spending pattern, with a modest 27% increase over the same period.
These contrasting trends highlight the diverse strategies employed by companies in different sectors, offering valuable insights for investors and analysts alike.
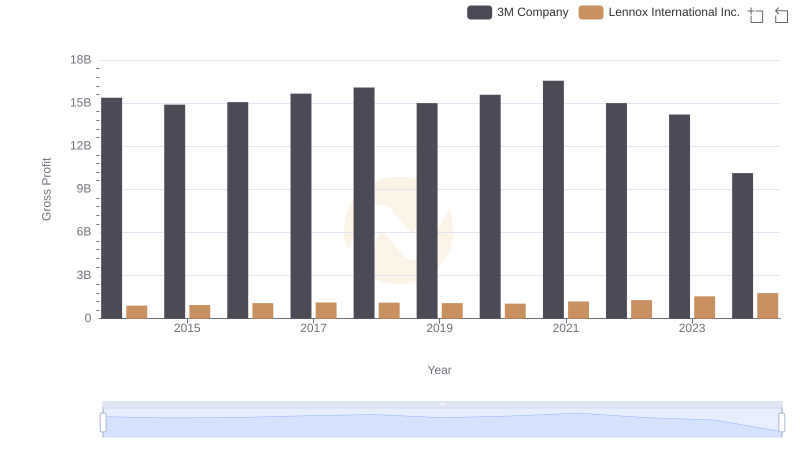
Who Generates Higher Gross Profit? 3M Company or Lennox International Inc.
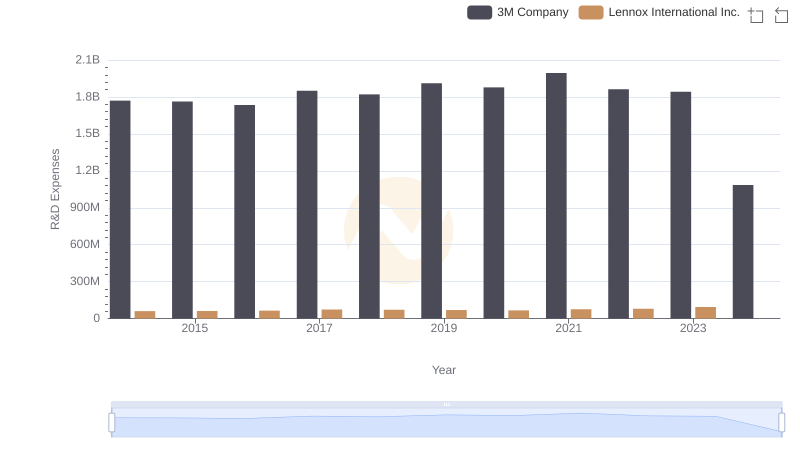
Research and Development Investment: 3M Company vs Lennox International Inc.

SG&A Efficiency Analysis: Comparing 3M Company and Hubbell Incorporated
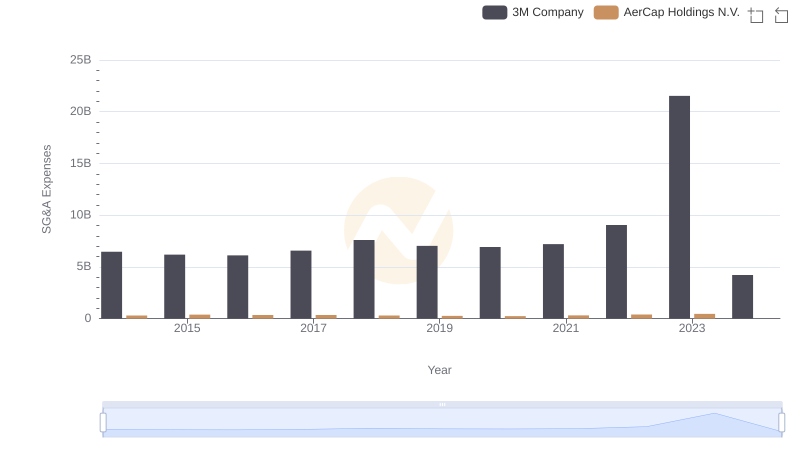
Who Optimizes SG&A Costs Better? 3M Company or AerCap Holdings N.V.
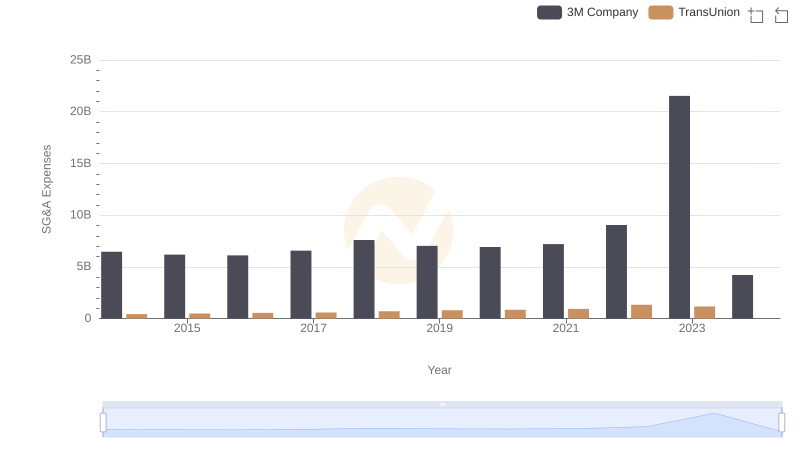
3M Company vs TransUnion: SG&A Expense Trends

Who Optimizes SG&A Costs Better? 3M Company or EMCOR Group, Inc.