| __timestamp | 3M Company | Hubbell Incorporated |
|---|---|---|
| Wednesday, January 1, 2014 | 6469000000 | 591600000 |
| Thursday, January 1, 2015 | 6182000000 | 617200000 |
| Friday, January 1, 2016 | 6111000000 | 622900000 |
| Sunday, January 1, 2017 | 6572000000 | 648200000 |
| Monday, January 1, 2018 | 7602000000 | 743500000 |
| Tuesday, January 1, 2019 | 7029000000 | 756100000 |
| Wednesday, January 1, 2020 | 6929000000 | 676300000 |
| Friday, January 1, 2021 | 7197000000 | 619200000 |
| Saturday, January 1, 2022 | 9049000000 | 762500000 |
| Sunday, January 1, 2023 | 21526000000 | 848600000 |
| Monday, January 1, 2024 | 4221000000 | 812500000 |
Unlocking the unknown
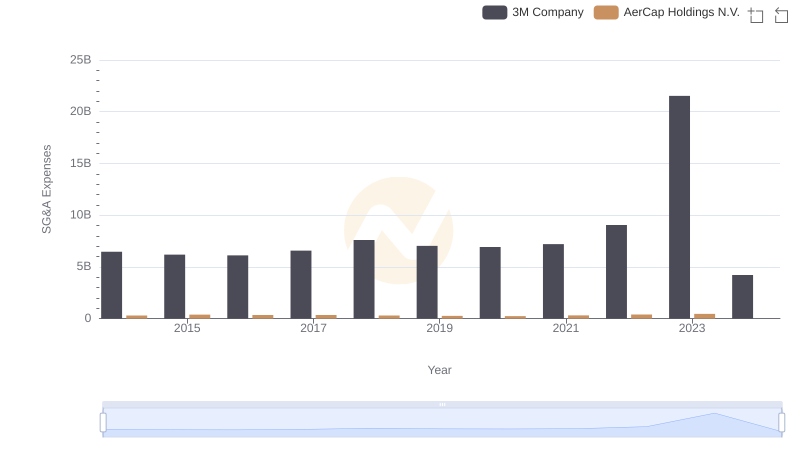
In the competitive landscape of industrial giants, understanding the efficiency of Selling, General, and Administrative (SG&A) expenses is crucial. Over the past decade, 3M Company and Hubbell Incorporated have showcased contrasting trends in their SG&A expenditures.
From 2014 to 2023, 3M's SG&A expenses fluctuated significantly, peaking in 2023 with a staggering 165% increase compared to 2014. This volatility reflects strategic shifts and market challenges.
In contrast, Hubbell's SG&A expenses have shown a more stable trajectory, with a modest 43% increase over the same period. This consistency suggests a disciplined approach to cost management.
Notably, data for 2024 is incomplete, leaving room for speculation on future trends. As these companies navigate economic uncertainties, their SG&A strategies will be pivotal in maintaining competitive edges.