| __timestamp | American Airlines Group Inc. | United Rentals, Inc. |
|---|---|---|
| Wednesday, January 1, 2014 | 42650000000 | 5685000000 |
| Thursday, January 1, 2015 | 40990000000 | 5817000000 |
| Friday, January 1, 2016 | 40180000000 | 5762000000 |
| Sunday, January 1, 2017 | 42207000000 | 6641000000 |
| Monday, January 1, 2018 | 44541000000 | 8047000000 |
| Tuesday, January 1, 2019 | 45768000000 | 9351000000 |
| Wednesday, January 1, 2020 | 17337000000 | 8530000000 |
| Friday, January 1, 2021 | 29882000000 | 9716000000 |
| Saturday, January 1, 2022 | 48971000000 | 11642000000 |
| Sunday, January 1, 2023 | 52788000000 | 14332000000 |
| Monday, January 1, 2024 | 15345000000 |
Unleashing the power of data
In the ever-evolving landscape of American business, two giants stand out: United Rentals, Inc. and American Airlines Group Inc. Over the past decade, these companies have navigated the turbulent waters of the U.S. economy, showcasing resilience and adaptability. From 2014 to 2023, American Airlines experienced a revenue rollercoaster, with a significant dip in 2020, dropping to just 43% of its 2019 revenue, likely due to the global pandemic. However, by 2023, it rebounded impressively, achieving a 23% increase over its 2019 figures. Meanwhile, United Rentals demonstrated steady growth, with its revenue more than doubling from 2014 to 2023. This consistent upward trajectory highlights its robust business model and strategic market positioning. As we look to the future, these trends offer valuable insights into the dynamic interplay of industry forces and economic resilience.
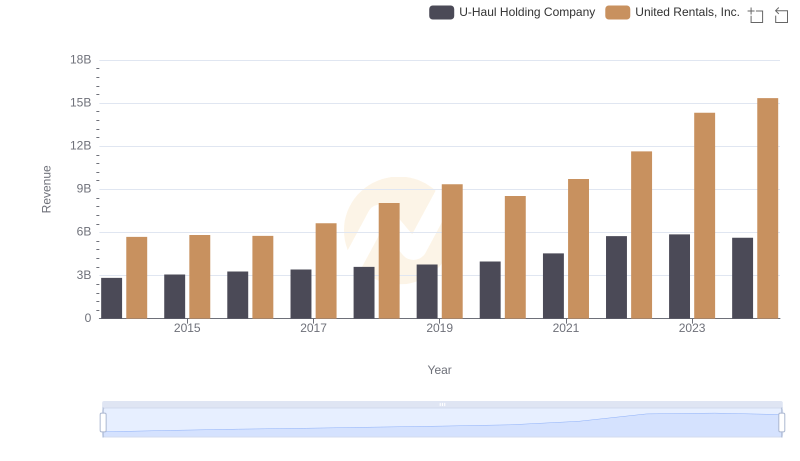
Revenue Showdown: United Rentals, Inc. vs U-Haul Holding Company
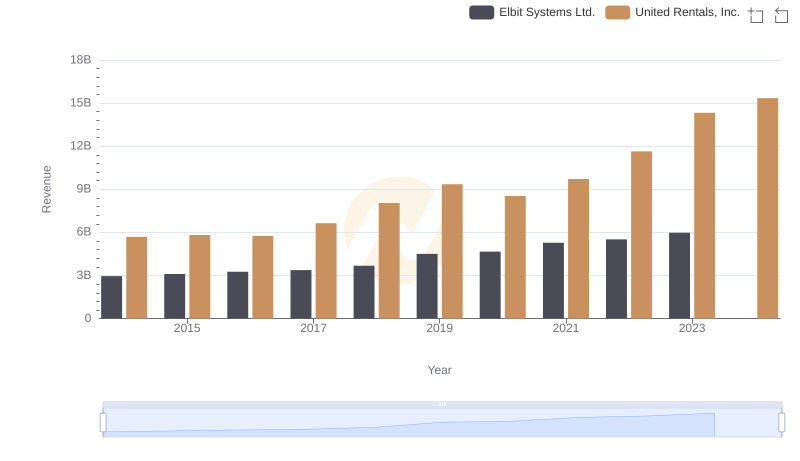
Breaking Down Revenue Trends: United Rentals, Inc. vs Elbit Systems Ltd.
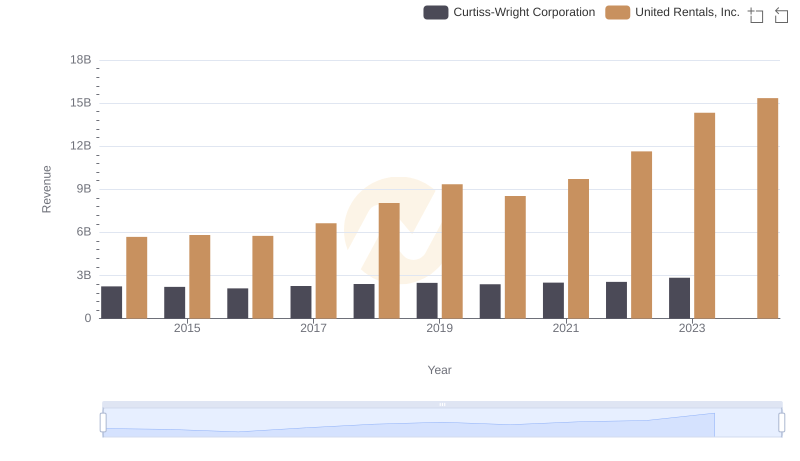
Who Generates More Revenue? United Rentals, Inc. or Curtiss-Wright Corporation
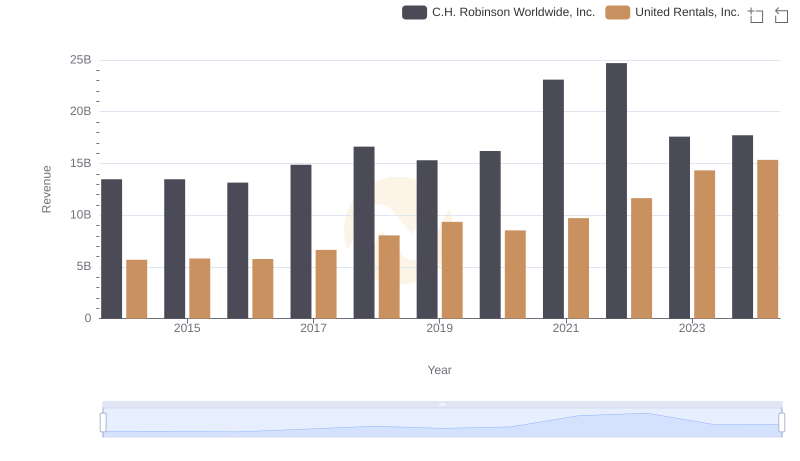
United Rentals, Inc. vs C.H. Robinson Worldwide, Inc.: Examining Key Revenue Metrics
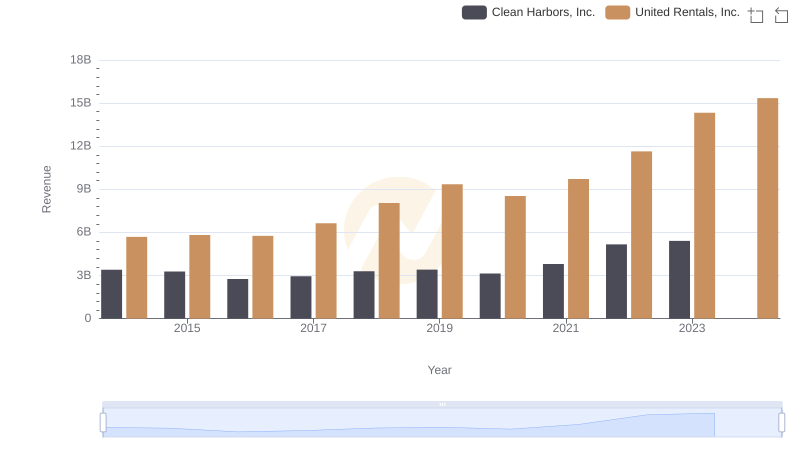
Breaking Down Revenue Trends: United Rentals, Inc. vs Clean Harbors, Inc.
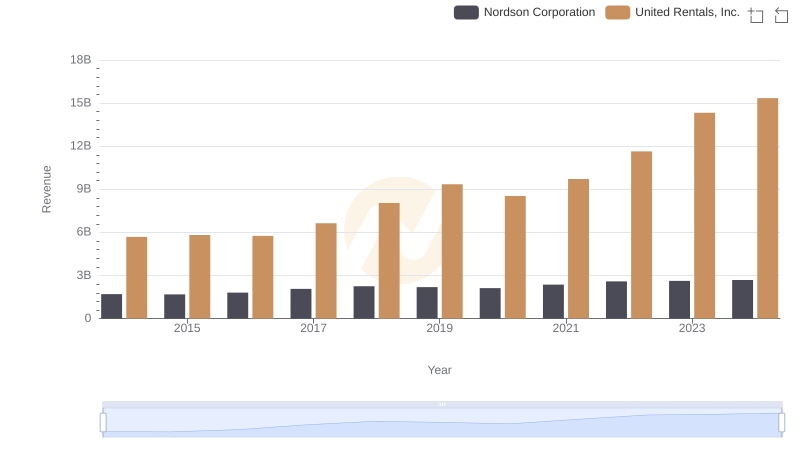
Revenue Showdown: United Rentals, Inc. vs Nordson Corporation
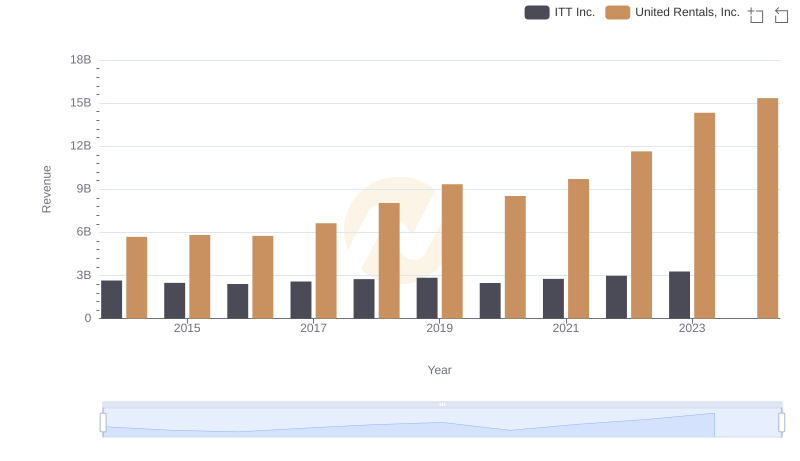
United Rentals, Inc. vs ITT Inc.: Annual Revenue Growth Compared
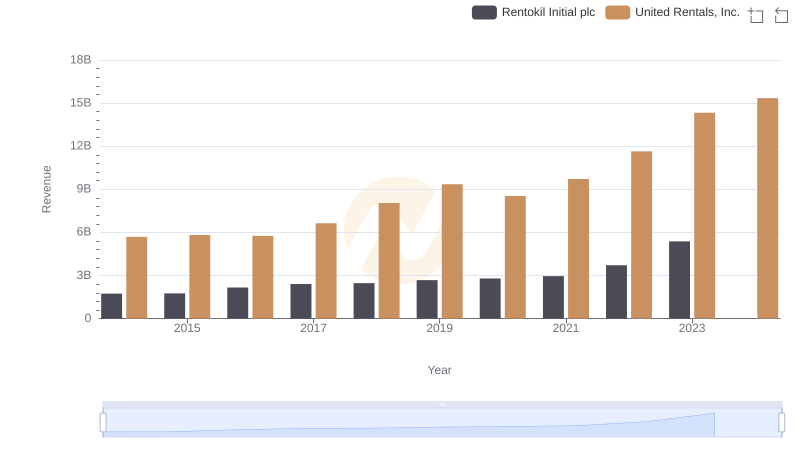
Revenue Showdown: United Rentals, Inc. vs Rentokil Initial plc
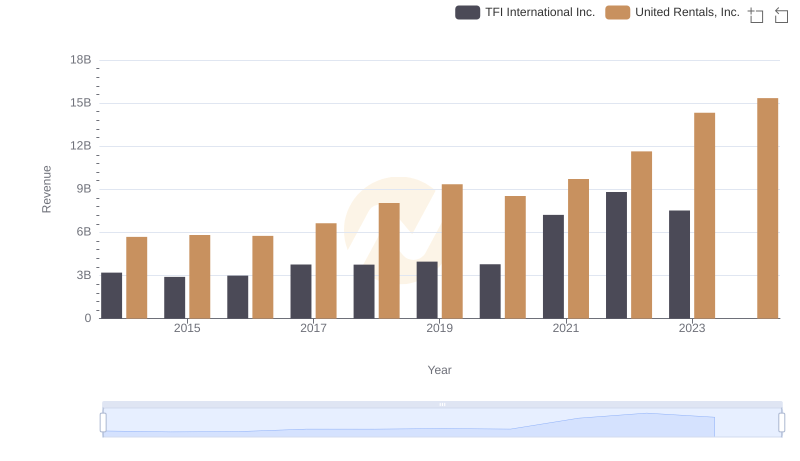
Who Generates More Revenue? United Rentals, Inc. or TFI International Inc.

United Rentals, Inc. vs Allegion plc: Examining Key Revenue Metrics
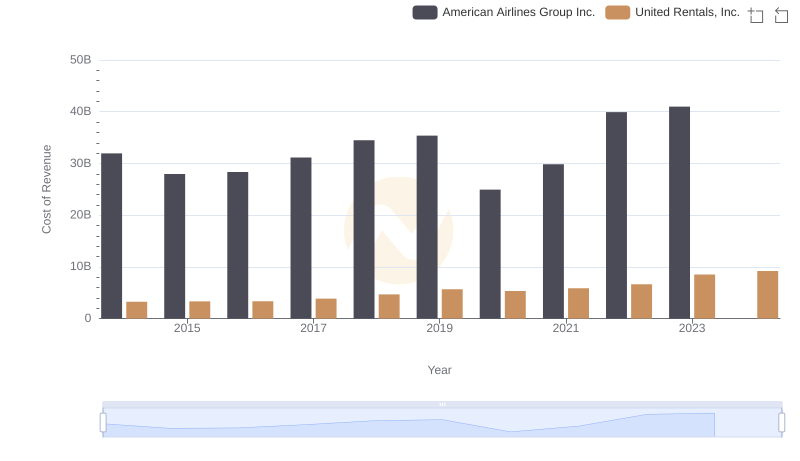
Cost of Revenue Trends: United Rentals, Inc. vs American Airlines Group Inc.
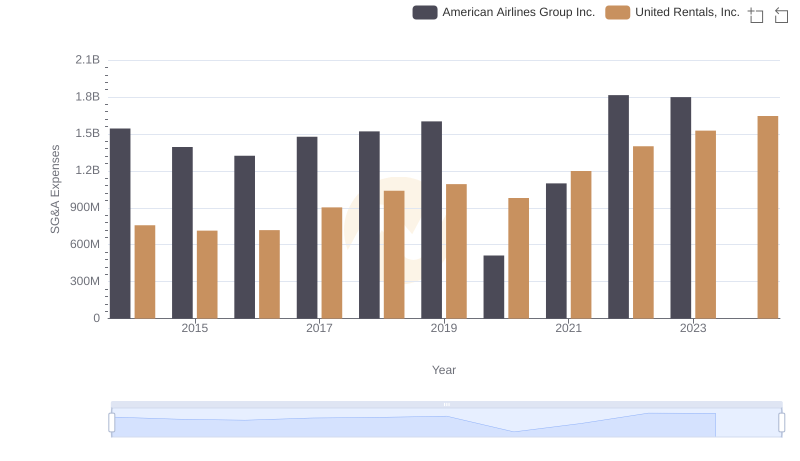
Selling, General, and Administrative Costs: United Rentals, Inc. vs American Airlines Group Inc.