| __timestamp | Parker-Hannifin Corporation | TFI International Inc. |
|---|---|---|
| Wednesday, January 1, 2014 | 3027744000 | 417323364 |
| Thursday, January 1, 2015 | 3056499000 | 352552803 |
| Friday, January 1, 2016 | 2537369000 | 358230042 |
| Sunday, January 1, 2017 | 2840350000 | 405214314 |
| Monday, January 1, 2018 | 3539551000 | 510006388 |
| Tuesday, January 1, 2019 | 3616840000 | 502631921 |
| Wednesday, January 1, 2020 | 3409002000 | 541885000 |
| Friday, January 1, 2021 | 3897960000 | 1037863000 |
| Saturday, January 1, 2022 | 4474341000 | 1426851000 |
| Sunday, January 1, 2023 | 6429302000 | 1265392000 |
| Monday, January 1, 2024 | 7127790000 |
Unleashing the power of data
In the ever-evolving landscape of industrial and logistics sectors, Parker-Hannifin Corporation and TFI International Inc. have emerged as key players. Over the past decade, Parker-Hannifin has demonstrated a robust growth trajectory, with its gross profit surging by approximately 135% from 2014 to 2023. This growth underscores its strategic prowess in the industrial sector. In contrast, TFI International, a leader in logistics, has seen its gross profit increase by nearly 200% during the same period, reflecting its adaptability and market expansion.
However, 2024 data for TFI International remains elusive, leaving room for speculation about its future performance. As these companies continue to navigate the complexities of their respective industries, their financial trends offer valuable insights into their strategic directions and market positions.
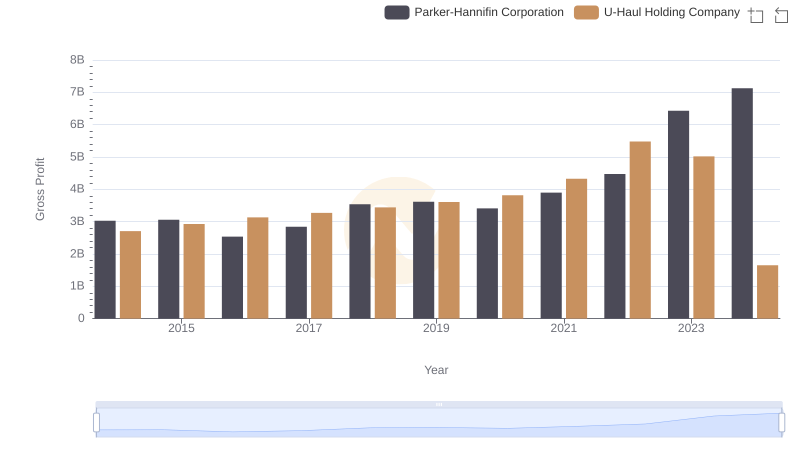
Gross Profit Trends Compared: Parker-Hannifin Corporation vs U-Haul Holding Company
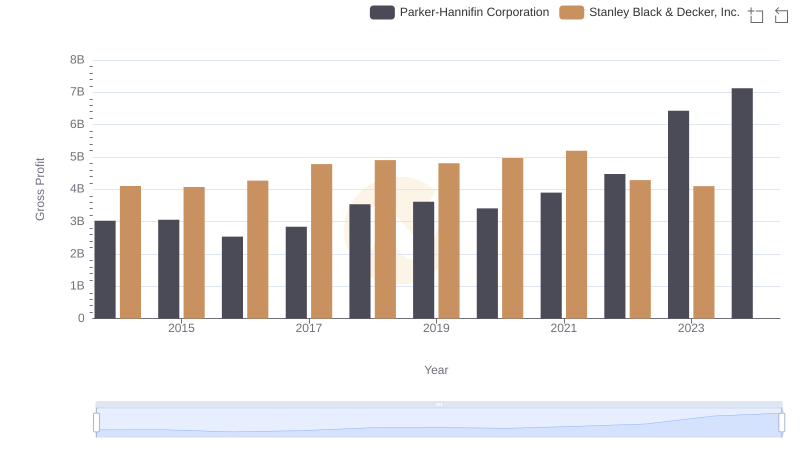
Gross Profit Comparison: Parker-Hannifin Corporation and Stanley Black & Decker, Inc. Trends
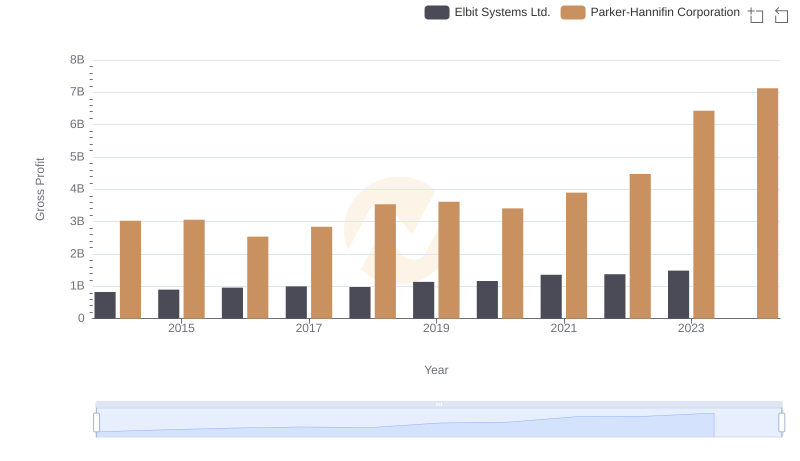
Gross Profit Trends Compared: Parker-Hannifin Corporation vs Elbit Systems Ltd.
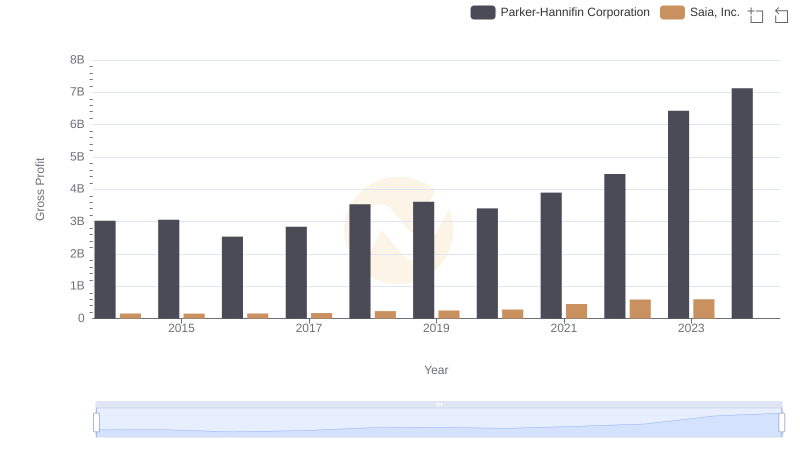
Gross Profit Trends Compared: Parker-Hannifin Corporation vs Saia, Inc.
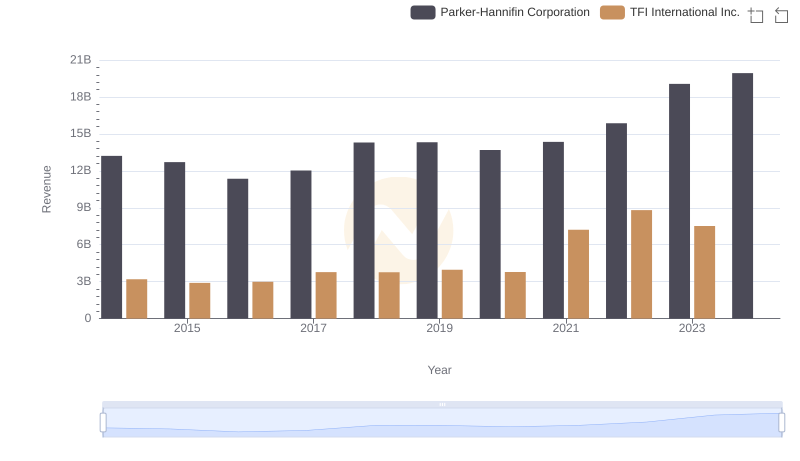
Parker-Hannifin Corporation vs TFI International Inc.: Annual Revenue Growth Compared
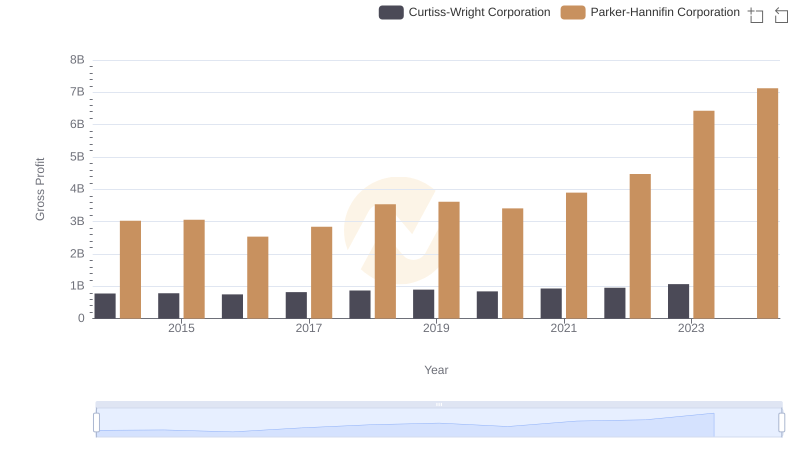
Who Generates Higher Gross Profit? Parker-Hannifin Corporation or Curtiss-Wright Corporation
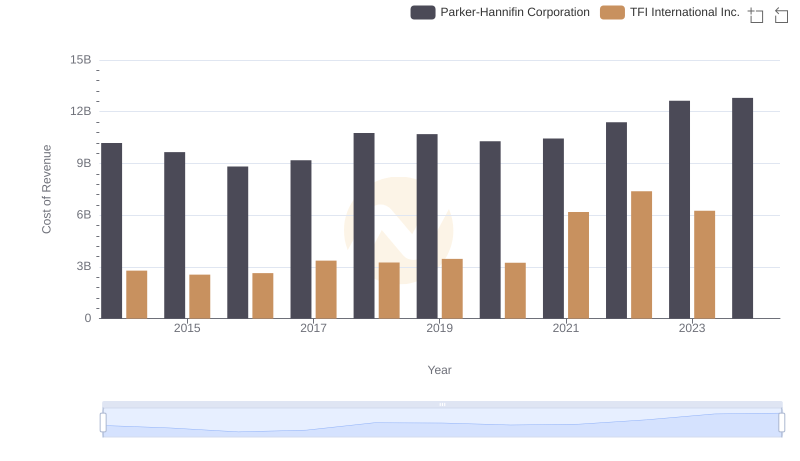
Cost of Revenue: Key Insights for Parker-Hannifin Corporation and TFI International Inc.
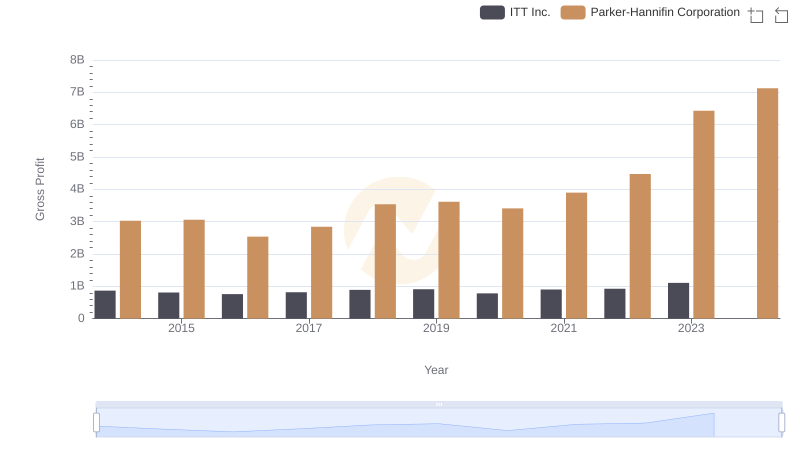
Key Insights on Gross Profit: Parker-Hannifin Corporation vs ITT Inc.

Who Generates Higher Gross Profit? Parker-Hannifin Corporation or Allegion plc