| __timestamp | Rockwell Automation, Inc. | Westinghouse Air Brake Technologies Corporation |
|---|---|---|
| Wednesday, January 1, 2014 | 1570100000 | 324539000 |
| Thursday, January 1, 2015 | 1506400000 | 319173000 |
| Friday, January 1, 2016 | 1467400000 | 327505000 |
| Sunday, January 1, 2017 | 1591500000 | 482852000 |
| Monday, January 1, 2018 | 1599000000 | 573644000 |
| Tuesday, January 1, 2019 | 1538500000 | 936600000 |
| Wednesday, January 1, 2020 | 1479800000 | 877100000 |
| Friday, January 1, 2021 | 1680000000 | 1005000000 |
| Saturday, January 1, 2022 | 1766700000 | 1020000000 |
| Sunday, January 1, 2023 | 2023700000 | 1139000000 |
| Monday, January 1, 2024 | 2002600000 | 1248000000 |
Igniting the spark of knowledge
In the ever-evolving landscape of industrial technology, understanding the financial strategies of key players is crucial. Rockwell Automation, Inc. and Westinghouse Air Brake Technologies Corporation have demonstrated distinct trends in their Selling, General, and Administrative (SG&A) expenses over the past decade. From 2014 to 2023, Rockwell Automation's SG&A expenses have shown a steady increase, peaking in 2023 with a 29% rise from 2014. In contrast, Westinghouse Air Brake Technologies Corporation's SG&A expenses have more than tripled, reflecting a strategic shift in their operational focus. Notably, 2023 data for Westinghouse is missing, indicating potential changes or reporting delays. This comparative analysis highlights the dynamic nature of financial management within the industrial sector, offering insights into how these corporations allocate resources to maintain competitive advantage.
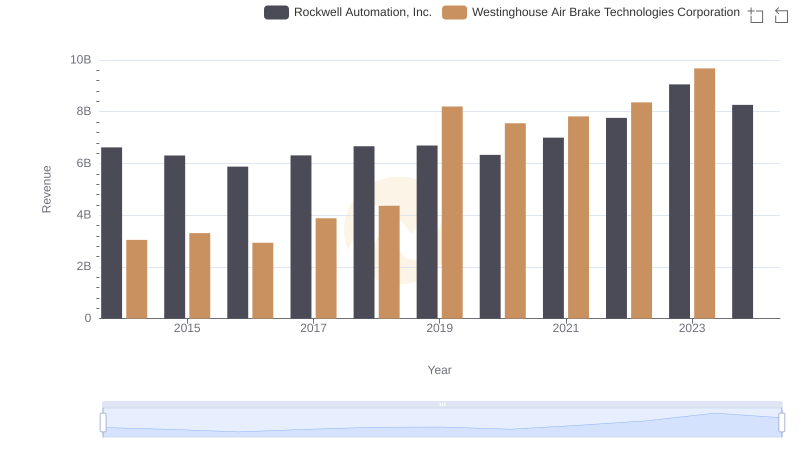
Westinghouse Air Brake Technologies Corporation vs Rockwell Automation, Inc.: Examining Key Revenue Metrics
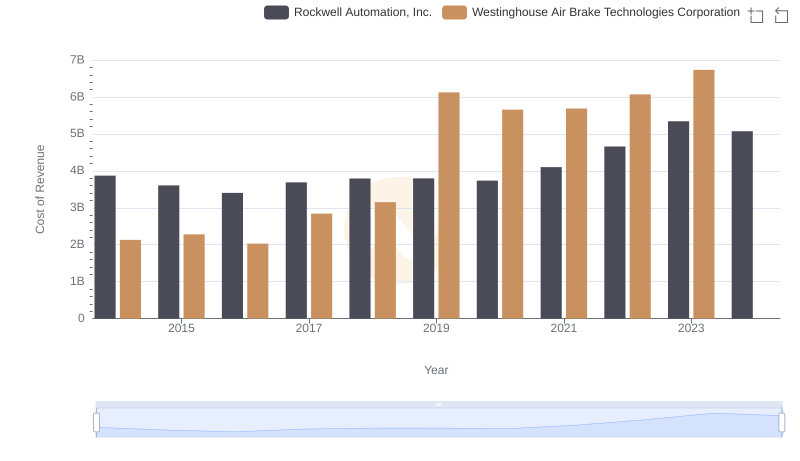
Westinghouse Air Brake Technologies Corporation vs Rockwell Automation, Inc.: Efficiency in Cost of Revenue Explored
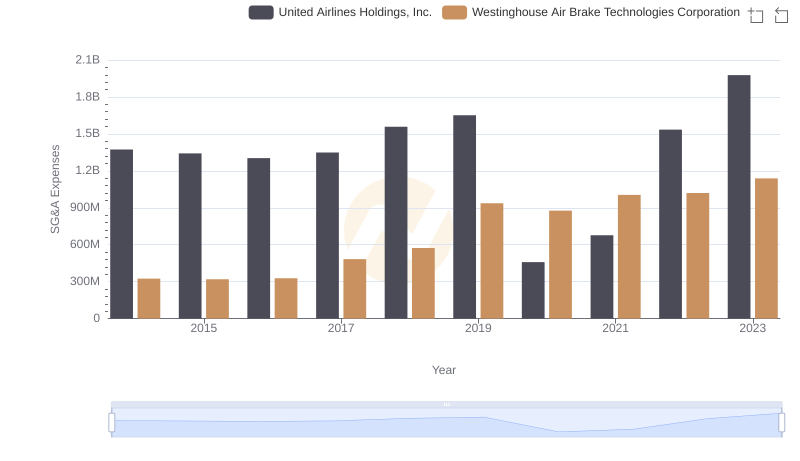
Operational Costs Compared: SG&A Analysis of Westinghouse Air Brake Technologies Corporation and United Airlines Holdings, Inc.
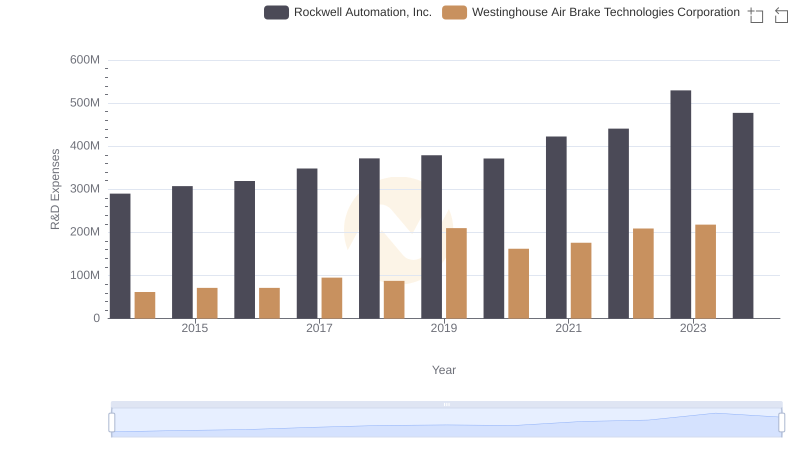
Westinghouse Air Brake Technologies Corporation vs Rockwell Automation, Inc.: Strategic Focus on R&D Spending
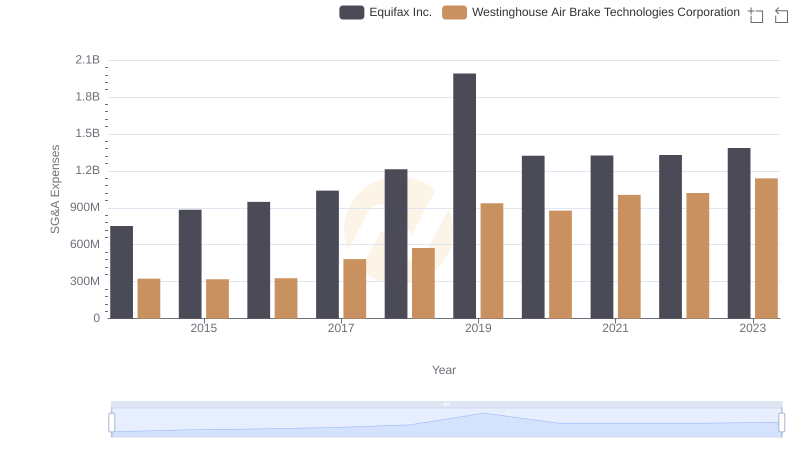
Breaking Down SG&A Expenses: Westinghouse Air Brake Technologies Corporation vs Equifax Inc.
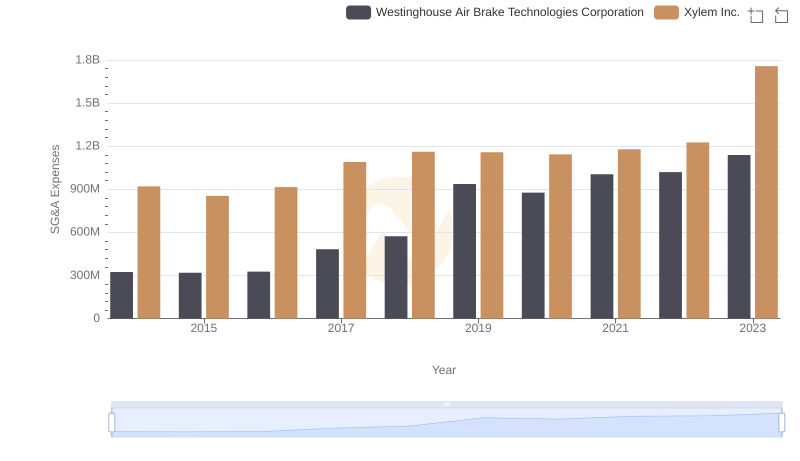
Who Optimizes SG&A Costs Better? Westinghouse Air Brake Technologies Corporation or Xylem Inc.
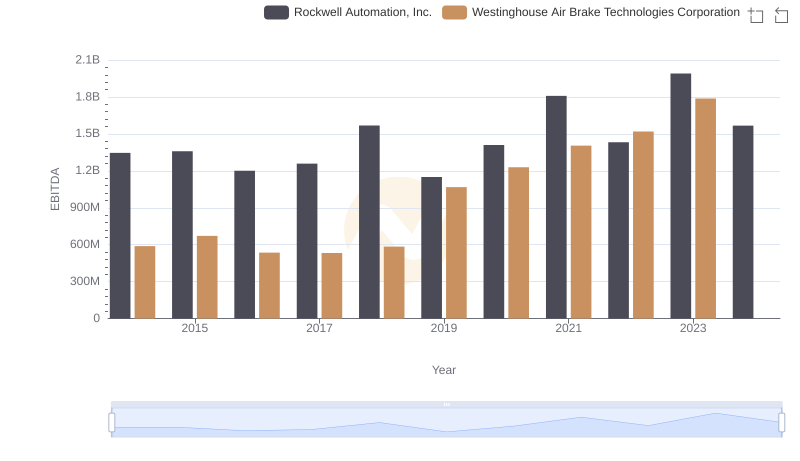
Westinghouse Air Brake Technologies Corporation and Rockwell Automation, Inc.: A Detailed Examination of EBITDA Performance