| __timestamp | Nordson Corporation | Watsco, Inc. |
|---|---|---|
| Wednesday, January 1, 2014 | 427302000 | 323674000 |
| Thursday, January 1, 2015 | 384160000 | 355865000 |
| Friday, January 1, 2016 | 460120000 | 365698000 |
| Sunday, January 1, 2017 | 547746000 | 375907000 |
| Monday, January 1, 2018 | 606502000 | 394177000 |
| Tuesday, January 1, 2019 | 588493000 | 391396000 |
| Wednesday, January 1, 2020 | 446951000 | 426942000 |
| Friday, January 1, 2021 | 703550000 | 656655000 |
| Saturday, January 1, 2022 | 771615000 | 863261000 |
| Sunday, January 1, 2023 | 786742000 | 829900000 |
| Monday, January 1, 2024 | 674001000 | 781775000 |
Unleashing insights
In the ever-evolving landscape of industrial giants, Watsco, Inc. and Nordson Corporation have showcased intriguing financial trajectories over the past decade. From 2014 to 2023, Nordson Corporation's EBITDA surged by approximately 84%, peaking in 2023. Meanwhile, Watsco, Inc. demonstrated a remarkable 156% growth, reaching its zenith in 2022. This period highlights Watsco's aggressive expansion strategy, outpacing Nordson's steady growth. Notably, 2021 marked a pivotal year for both companies, with Nordson's EBITDA jumping by 54% and Watsco's by 72% compared to the previous year. However, 2024 data for Watsco remains elusive, leaving room for speculation on its future trajectory. As these industry leaders continue to navigate economic challenges, their financial performance offers valuable insights into strategic resilience and market adaptability.
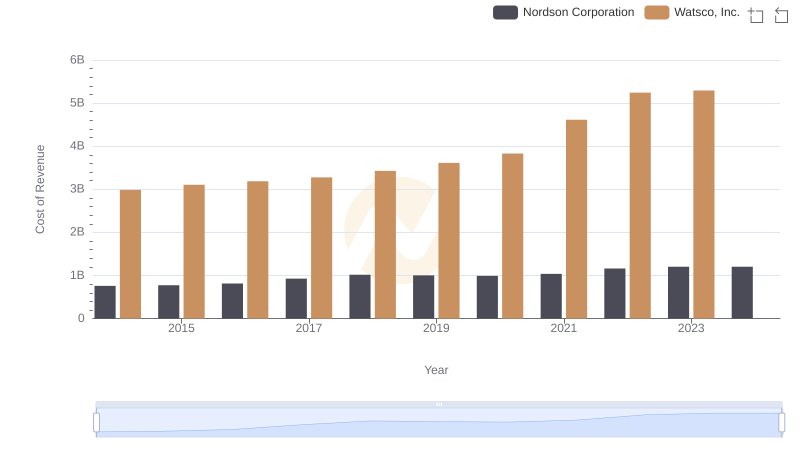
Analyzing Cost of Revenue: Watsco, Inc. and Nordson Corporation
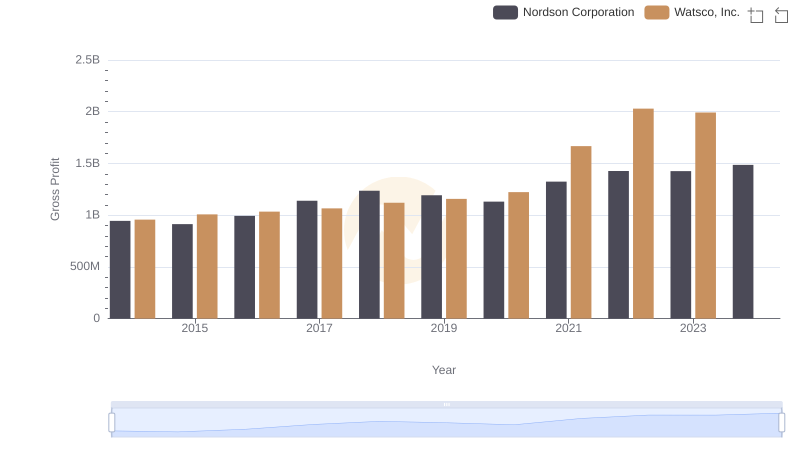
Watsco, Inc. and Nordson Corporation: A Detailed Gross Profit Analysis
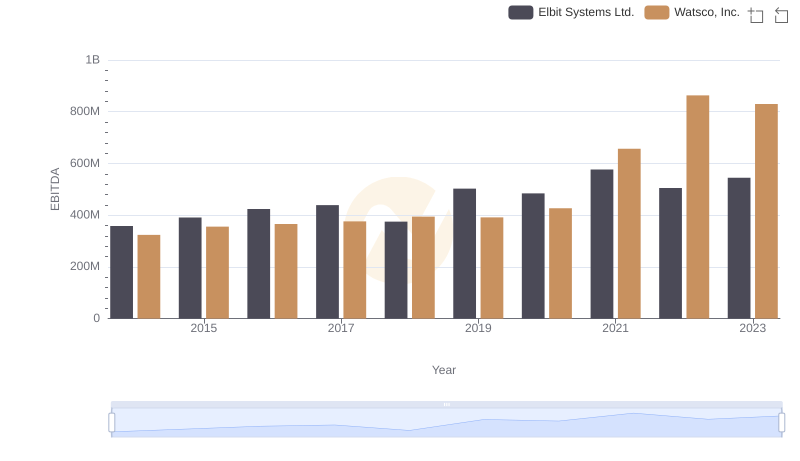
Watsco, Inc. vs Elbit Systems Ltd.: In-Depth EBITDA Performance Comparison
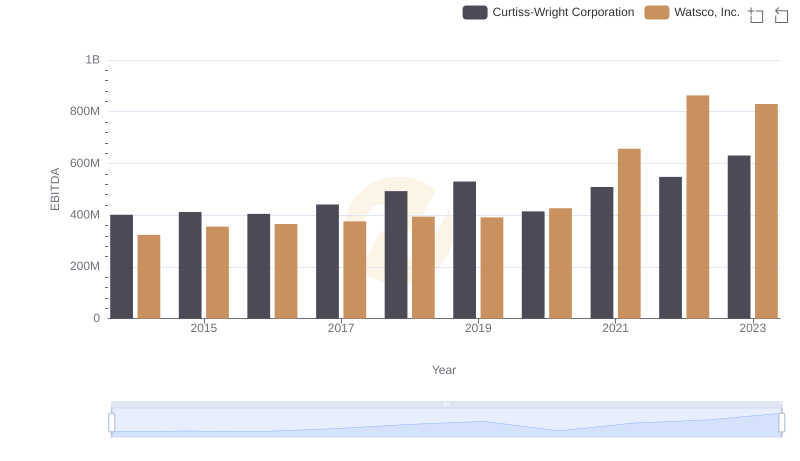
EBITDA Analysis: Evaluating Watsco, Inc. Against Curtiss-Wright Corporation
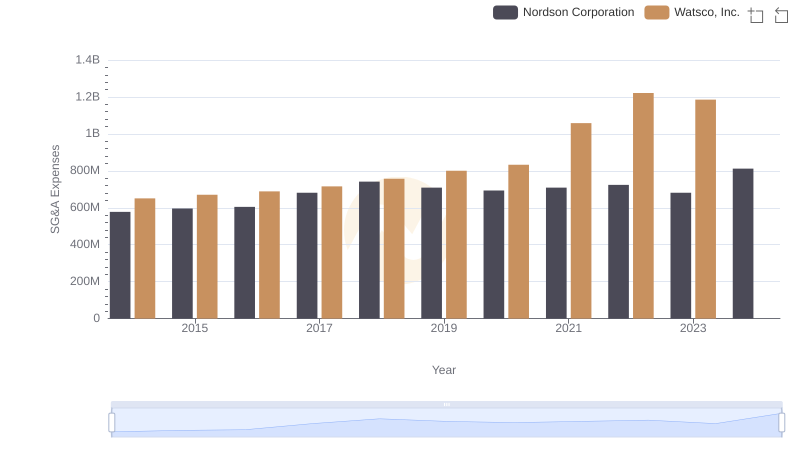
Who Optimizes SG&A Costs Better? Watsco, Inc. or Nordson Corporation
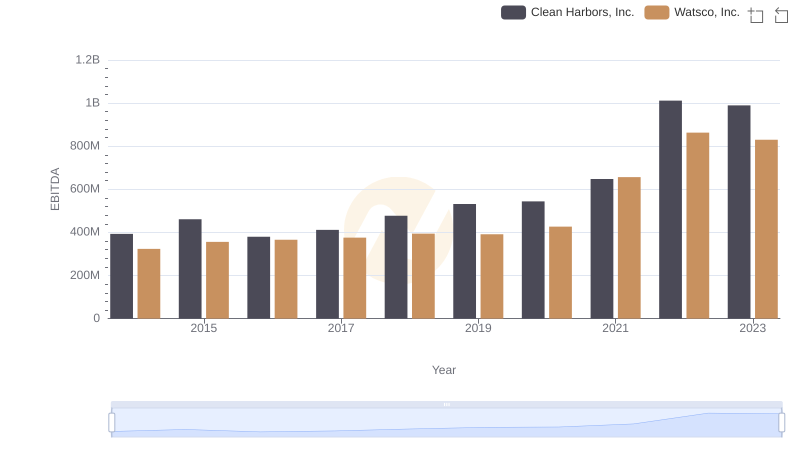
A Side-by-Side Analysis of EBITDA: Watsco, Inc. and Clean Harbors, Inc.
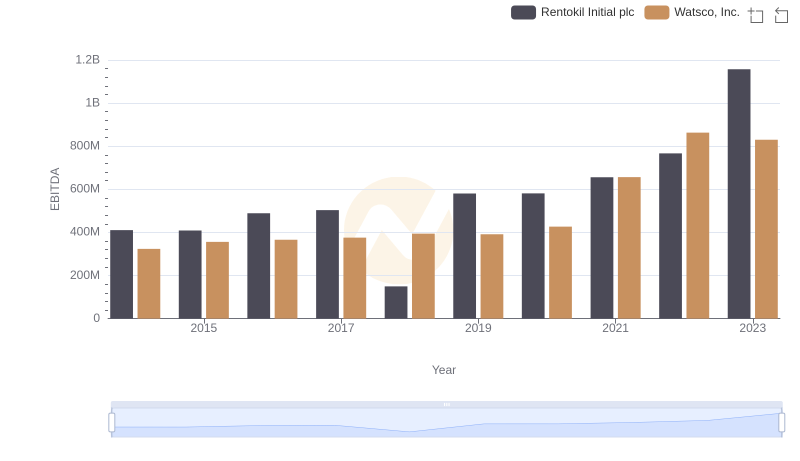
A Side-by-Side Analysis of EBITDA: Watsco, Inc. and Rentokil Initial plc
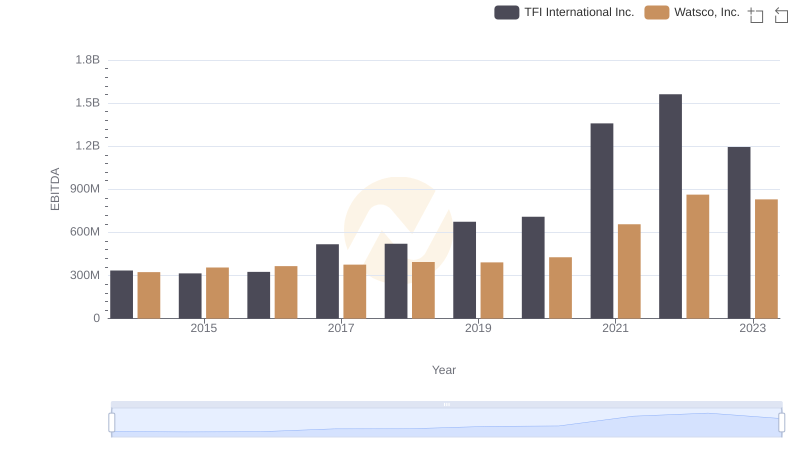
Watsco, Inc. vs TFI International Inc.: In-Depth EBITDA Performance Comparison