| __timestamp | Rentokil Initial plc | Watsco, Inc. |
|---|---|---|
| Wednesday, January 1, 2014 | 410400000 | 323674000 |
| Thursday, January 1, 2015 | 408700000 | 355865000 |
| Friday, January 1, 2016 | 489000000 | 365698000 |
| Sunday, January 1, 2017 | 503200000 | 375907000 |
| Monday, January 1, 2018 | 149800000 | 394177000 |
| Tuesday, January 1, 2019 | 580600000 | 391396000 |
| Wednesday, January 1, 2020 | 581000000 | 426942000 |
| Friday, January 1, 2021 | 656000000 | 656655000 |
| Saturday, January 1, 2022 | 767000000 | 863261000 |
| Sunday, January 1, 2023 | 1157000000 | 829900000 |
| Monday, January 1, 2024 | 781775000 |
Unlocking the unknown
In the ever-evolving landscape of global business, understanding the financial health of companies is crucial. This analysis delves into the EBITDA performance of two industry giants: Watsco, Inc., a leader in HVAC distribution, and Rentokil Initial plc, a prominent pest control and hygiene services provider. Over the past decade, from 2014 to 2023, Rentokil Initial plc has demonstrated a remarkable growth trajectory, with its EBITDA increasing by approximately 182%, peaking in 2023. In contrast, Watsco, Inc. has shown a steady rise, with a 156% increase over the same period. Notably, 2021 marked a pivotal year for both companies, with Watsco, Inc. achieving a significant 54% jump in EBITDA, while Rentokil Initial plc saw a 16% increase. This side-by-side analysis highlights the resilience and strategic growth of these companies in their respective sectors, offering valuable insights for investors and industry analysts alike.
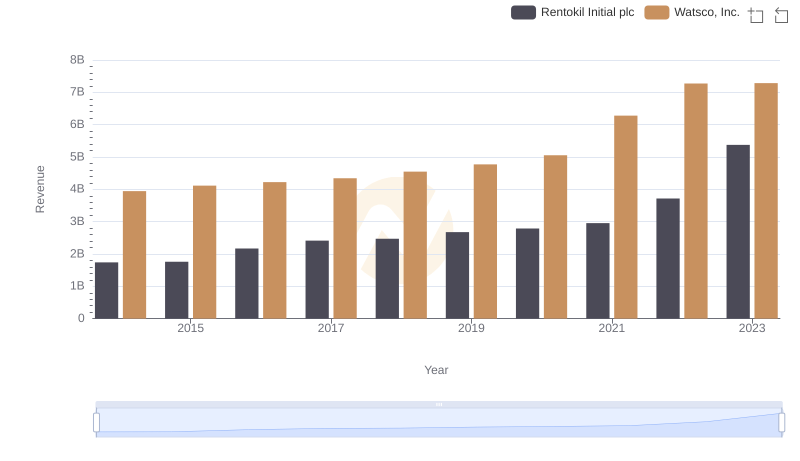
Watsco, Inc. and Rentokil Initial plc: A Comprehensive Revenue Analysis
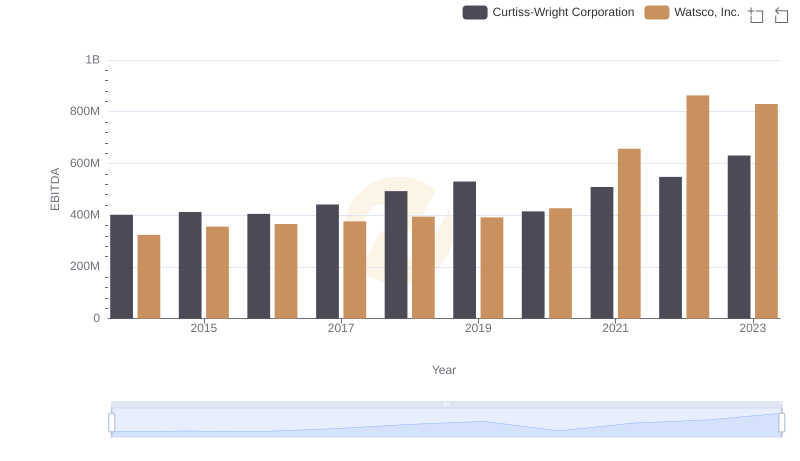
EBITDA Analysis: Evaluating Watsco, Inc. Against Curtiss-Wright Corporation
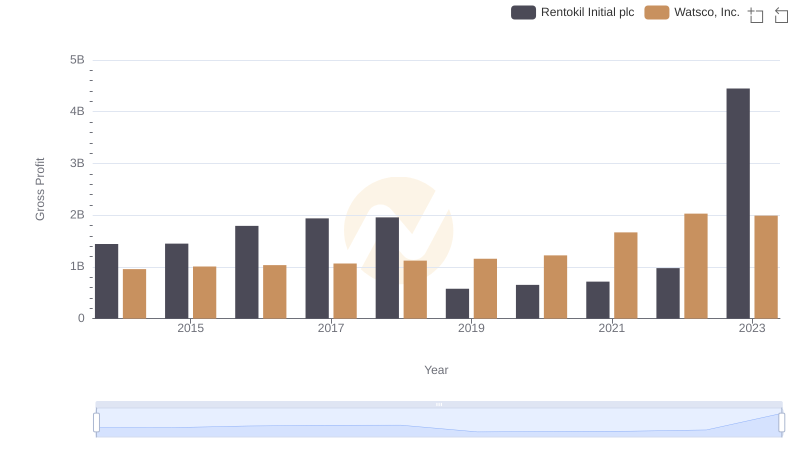
Gross Profit Trends Compared: Watsco, Inc. vs Rentokil Initial plc
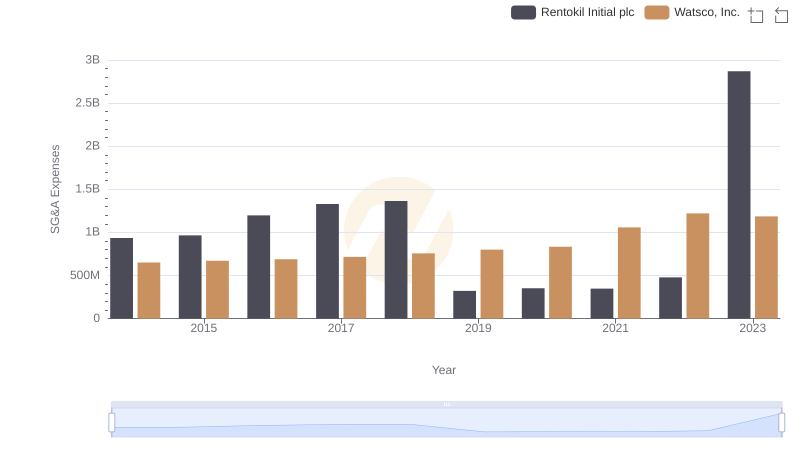
SG&A Efficiency Analysis: Comparing Watsco, Inc. and Rentokil Initial plc
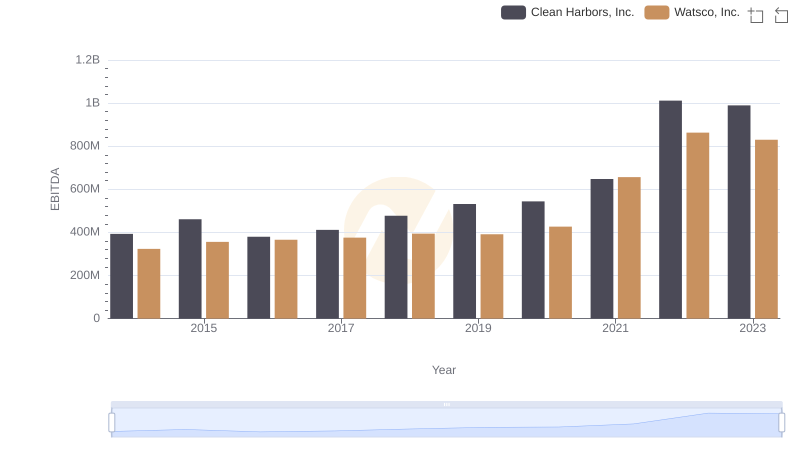
A Side-by-Side Analysis of EBITDA: Watsco, Inc. and Clean Harbors, Inc.
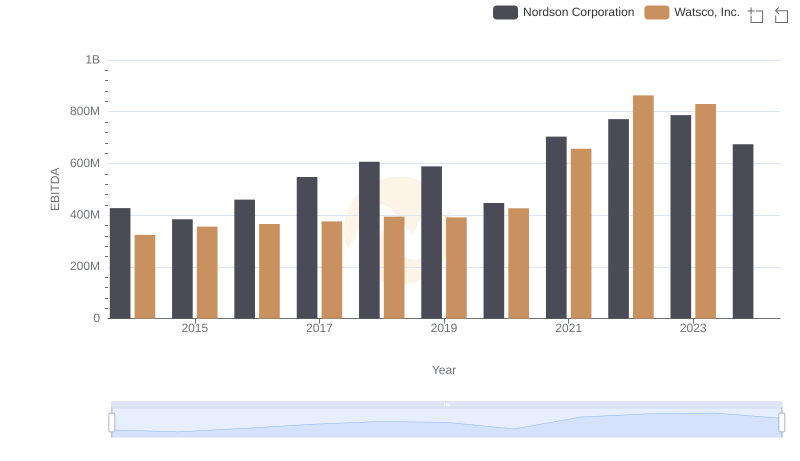
A Side-by-Side Analysis of EBITDA: Watsco, Inc. and Nordson Corporation
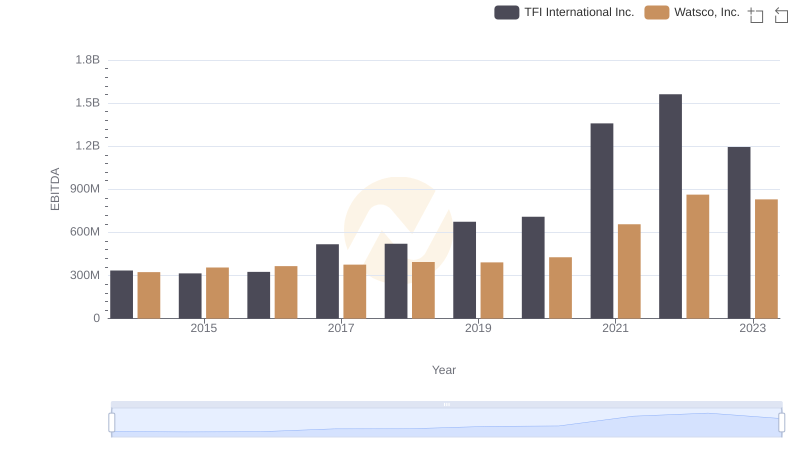
Watsco, Inc. vs TFI International Inc.: In-Depth EBITDA Performance Comparison
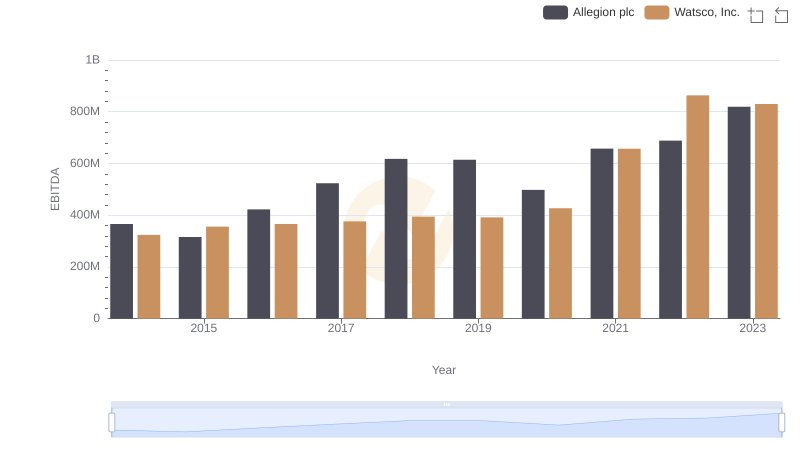
Watsco, Inc. vs Allegion plc: In-Depth EBITDA Performance Comparison