| __timestamp | Clean Harbors, Inc. | Watsco, Inc. |
|---|---|---|
| Wednesday, January 1, 2014 | 393092000 | 323674000 |
| Thursday, January 1, 2015 | 461019000 | 355865000 |
| Friday, January 1, 2016 | 380027000 | 365698000 |
| Sunday, January 1, 2017 | 411975000 | 375907000 |
| Monday, January 1, 2018 | 477159000 | 394177000 |
| Tuesday, January 1, 2019 | 531861000 | 391396000 |
| Wednesday, January 1, 2020 | 544047000 | 426942000 |
| Friday, January 1, 2021 | 647725000 | 656655000 |
| Saturday, January 1, 2022 | 1011488000 | 863261000 |
| Sunday, January 1, 2023 | 989565000 | 829900000 |
| Monday, January 1, 2024 | 799401000 | 781775000 |
Unlocking the unknown
In the ever-evolving landscape of American business, understanding the financial health of companies is crucial. EBITDA, or Earnings Before Interest, Taxes, Depreciation, and Amortization, serves as a key indicator of a company's operational performance. This analysis delves into the EBITDA trends of two industry giants: Watsco, Inc. and Clean Harbors, Inc., from 2014 to 2023.
Over this decade, Clean Harbors, Inc. demonstrated a robust growth trajectory, with its EBITDA increasing by approximately 150%. Notably, 2022 marked a peak, with EBITDA reaching nearly 1 billion, a testament to its strategic initiatives and market adaptability. Meanwhile, Watsco, Inc. also showcased impressive growth, with its EBITDA rising by around 160%, peaking in 2022 as well. This side-by-side analysis highlights the resilience and strategic prowess of these companies in navigating economic challenges and capitalizing on opportunities.
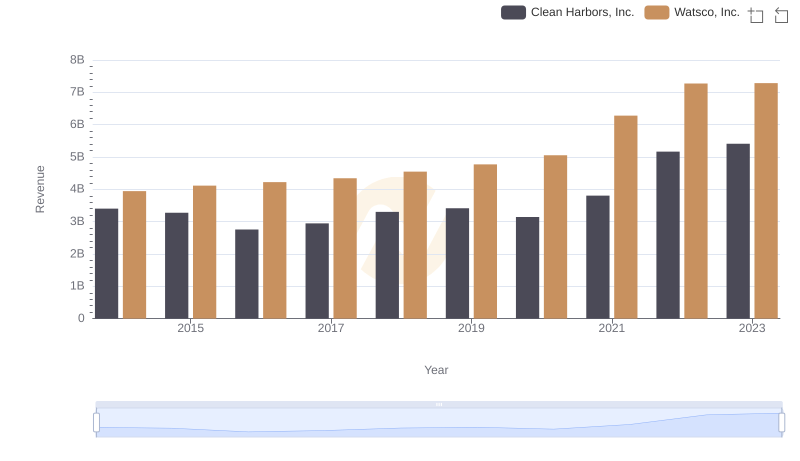
Watsco, Inc. vs Clean Harbors, Inc.: Annual Revenue Growth Compared
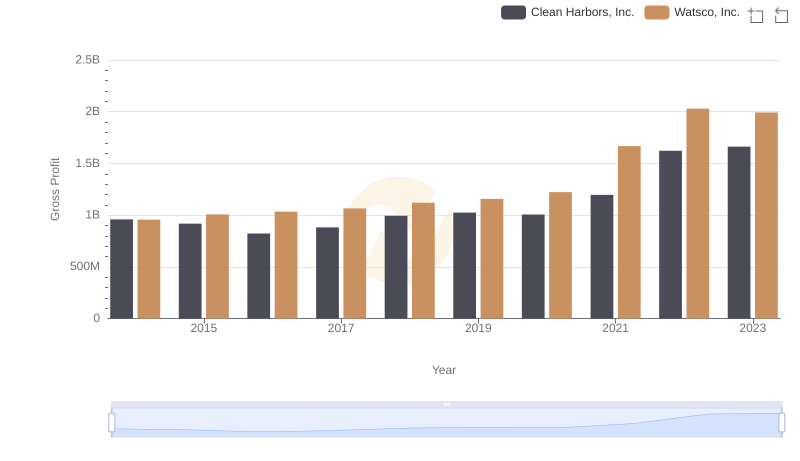
Gross Profit Trends Compared: Watsco, Inc. vs Clean Harbors, Inc.
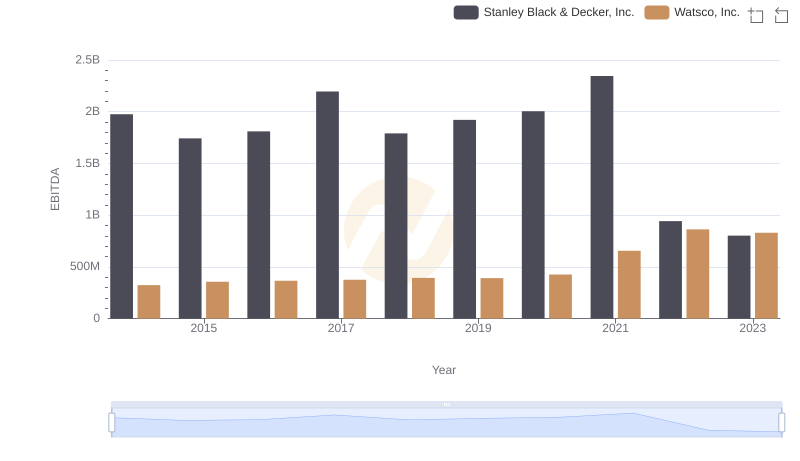
Comparative EBITDA Analysis: Watsco, Inc. vs Stanley Black & Decker, Inc.
Operational Costs Compared: SG&A Analysis of Watsco, Inc. and Clean Harbors, Inc.
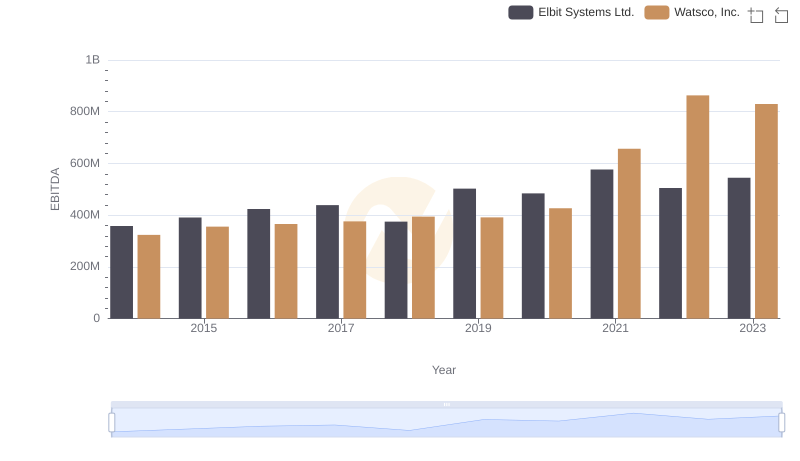
Watsco, Inc. vs Elbit Systems Ltd.: In-Depth EBITDA Performance Comparison
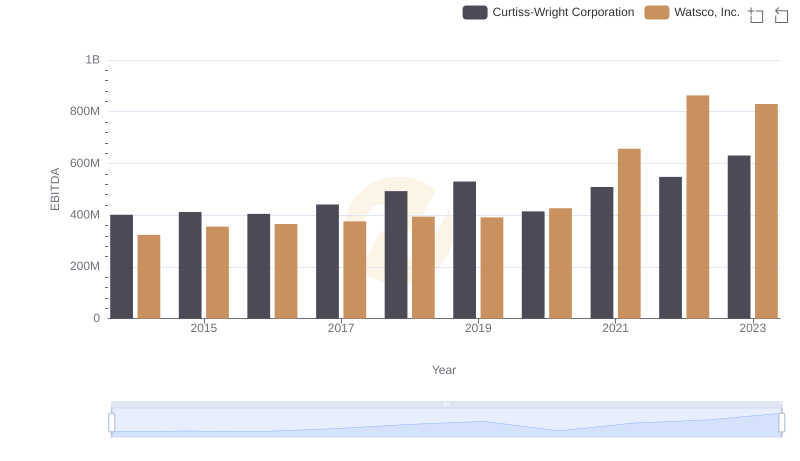
EBITDA Analysis: Evaluating Watsco, Inc. Against Curtiss-Wright Corporation
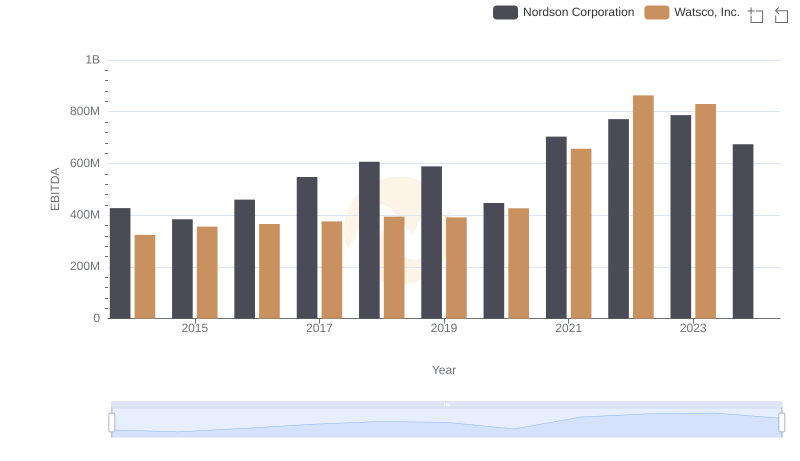
A Side-by-Side Analysis of EBITDA: Watsco, Inc. and Nordson Corporation
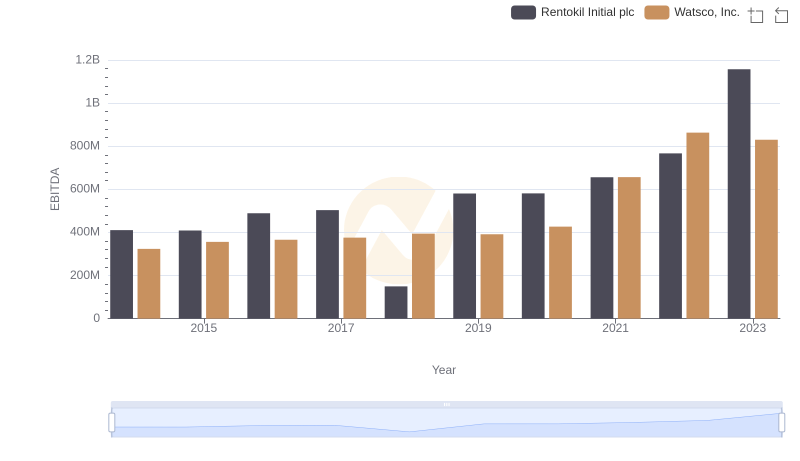
A Side-by-Side Analysis of EBITDA: Watsco, Inc. and Rentokil Initial plc