| __timestamp | Saia, Inc. | Watsco, Inc. |
|---|---|---|
| Wednesday, January 1, 2014 | 37563000 | 650655000 |
| Thursday, January 1, 2015 | 26832000 | 670609000 |
| Friday, January 1, 2016 | 39625000 | 688952000 |
| Sunday, January 1, 2017 | 37162000 | 715671000 |
| Monday, January 1, 2018 | 38425000 | 757452000 |
| Tuesday, January 1, 2019 | 43073000 | 800328000 |
| Wednesday, January 1, 2020 | 49761000 | 833051000 |
| Friday, January 1, 2021 | 61345000 | 1058316000 |
| Saturday, January 1, 2022 | 56601000 | 1221382000 |
| Sunday, January 1, 2023 | 67984000 | 1185626000 |
| Monday, January 1, 2024 | 1262938000 |
Unleashing insights
In the ever-evolving landscape of corporate finance, understanding the nuances of Selling, General, and Administrative (SG&A) expenses is crucial. Over the past decade, Watsco, Inc. and Saia, Inc. have demonstrated contrasting trajectories in their SG&A expenditures. From 2014 to 2023, Watsco, Inc. consistently outpaced Saia, Inc., with its SG&A expenses growing by approximately 82%, peaking at over $1.2 billion in 2022. In contrast, Saia, Inc. saw a more modest increase of around 81%, reaching nearly $68 million in 2023. This disparity highlights Watsco's expansive operational scale compared to Saia's more conservative growth. As businesses navigate the complexities of financial management, these insights into SG&A trends offer valuable lessons in strategic planning and resource allocation.
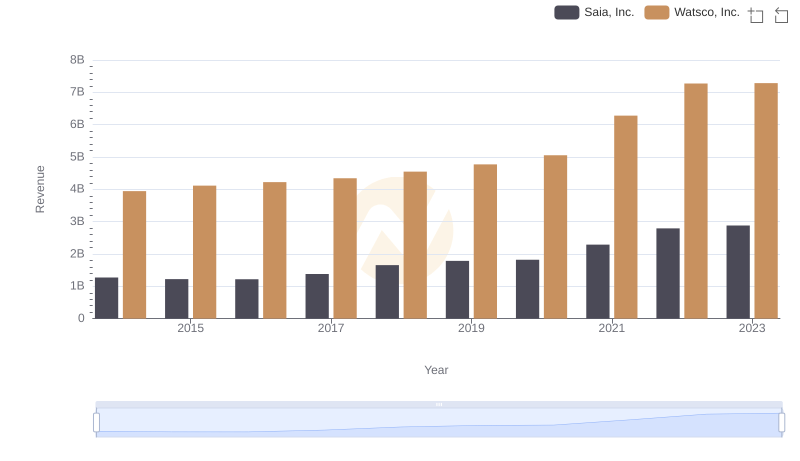
Annual Revenue Comparison: Watsco, Inc. vs Saia, Inc.
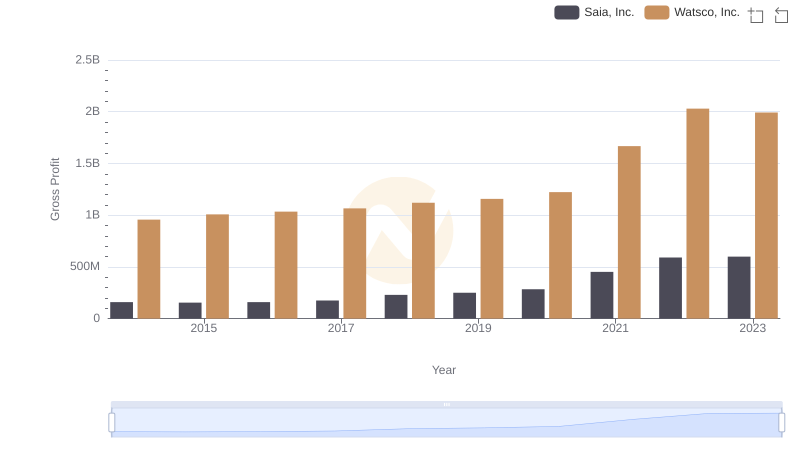
Gross Profit Analysis: Comparing Watsco, Inc. and Saia, Inc.
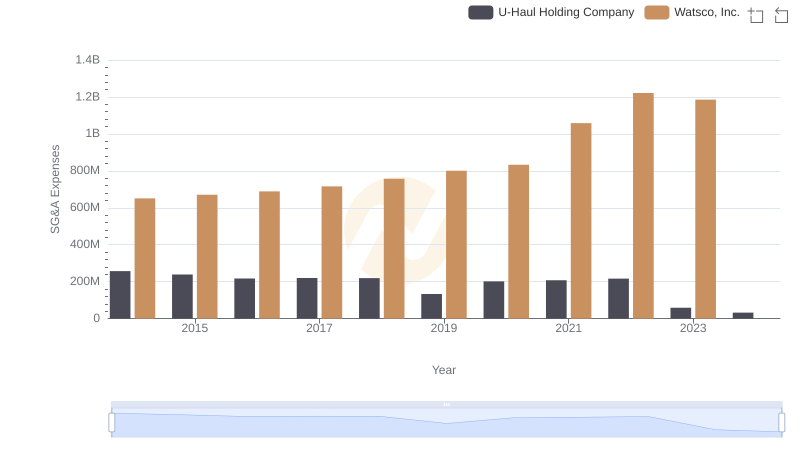
Who Optimizes SG&A Costs Better? Watsco, Inc. or U-Haul Holding Company
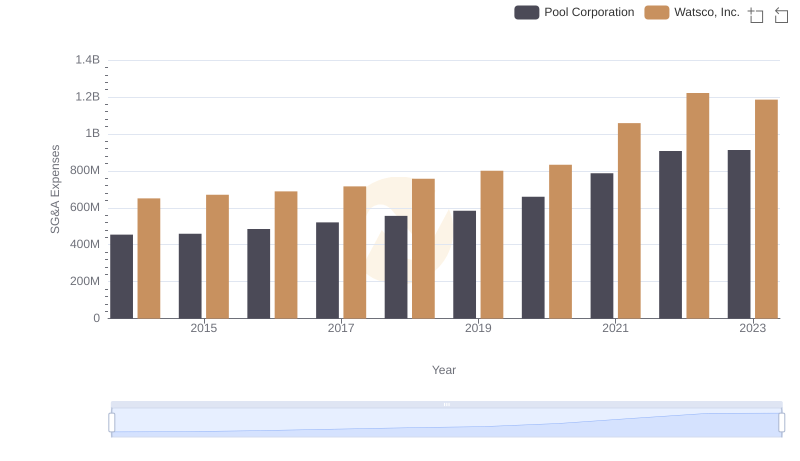
Breaking Down SG&A Expenses: Watsco, Inc. vs Pool Corporation
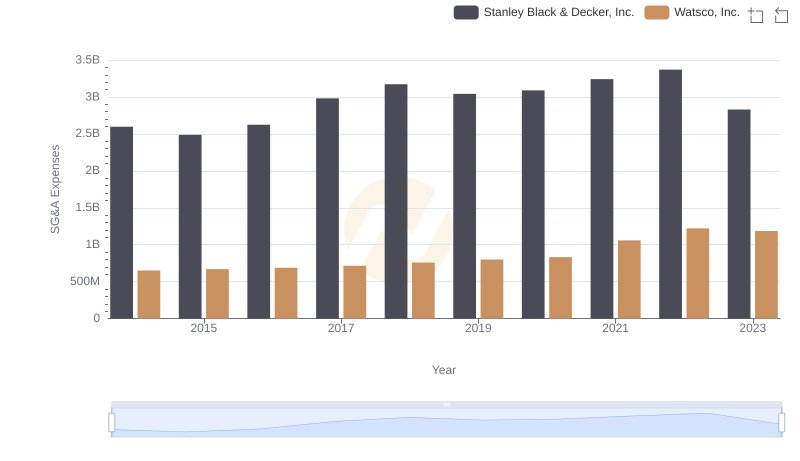
Cost Management Insights: SG&A Expenses for Watsco, Inc. and Stanley Black & Decker, Inc.
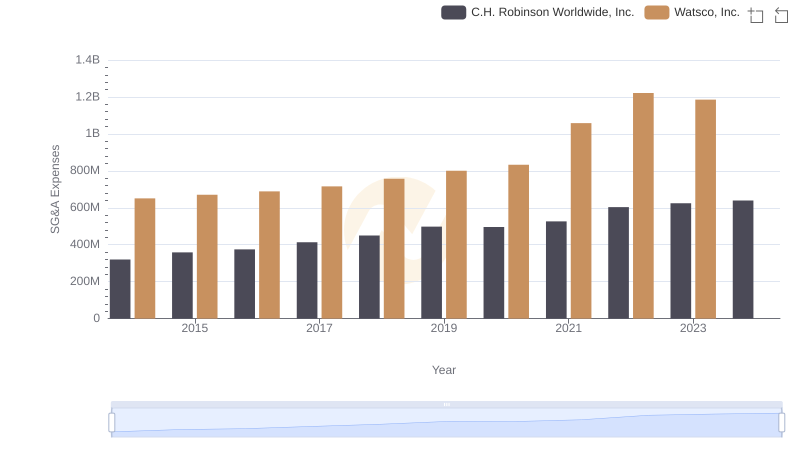
Watsco, Inc. or C.H. Robinson Worldwide, Inc.: Who Manages SG&A Costs Better?
Operational Costs Compared: SG&A Analysis of Watsco, Inc. and Clean Harbors, Inc.