| __timestamp | Rentokil Initial plc | Watsco, Inc. |
|---|---|---|
| Wednesday, January 1, 2014 | 935700000 | 650655000 |
| Thursday, January 1, 2015 | 965700000 | 670609000 |
| Friday, January 1, 2016 | 1197600000 | 688952000 |
| Sunday, January 1, 2017 | 1329600000 | 715671000 |
| Monday, January 1, 2018 | 1364000000 | 757452000 |
| Tuesday, January 1, 2019 | 322500000 | 800328000 |
| Wednesday, January 1, 2020 | 352000000 | 833051000 |
| Friday, January 1, 2021 | 348600000 | 1058316000 |
| Saturday, January 1, 2022 | 479000000 | 1221382000 |
| Sunday, January 1, 2023 | 2870000000 | 1185626000 |
| Monday, January 1, 2024 | 1262938000 |
Unleashing the power of data
In the ever-evolving landscape of corporate finance, understanding the efficiency of Selling, General, and Administrative (SG&A) expenses is crucial for investors and stakeholders. This analysis delves into the SG&A trends of two industry giants: Watsco, Inc. and Rentokil Initial plc, from 2014 to 2023.
Over the past decade, Rentokil Initial plc has demonstrated a significant increase in SG&A expenses, peaking in 2023 with a staggering 180% rise compared to 2014. This surge reflects strategic investments and expansion efforts. In contrast, Watsco, Inc. has shown a more stable growth trajectory, with a 82% increase over the same period, indicating a consistent approach to managing operational costs.
The data reveals Rentokil's aggressive growth strategy, while Watsco's steady increase suggests a focus on sustainable expansion. Investors should consider these trends when evaluating the companies' long-term financial health.
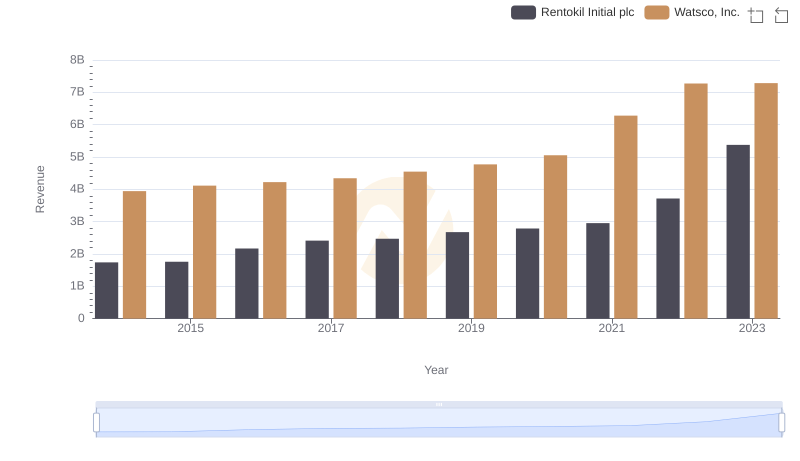
Watsco, Inc. and Rentokil Initial plc: A Comprehensive Revenue Analysis
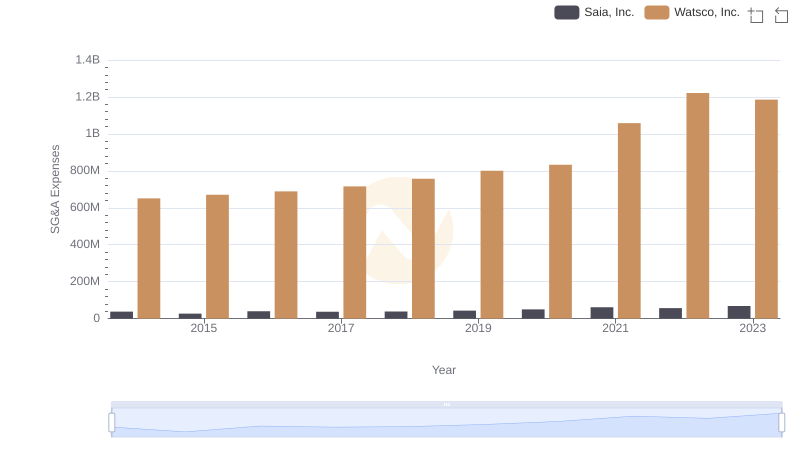
Breaking Down SG&A Expenses: Watsco, Inc. vs Saia, Inc.
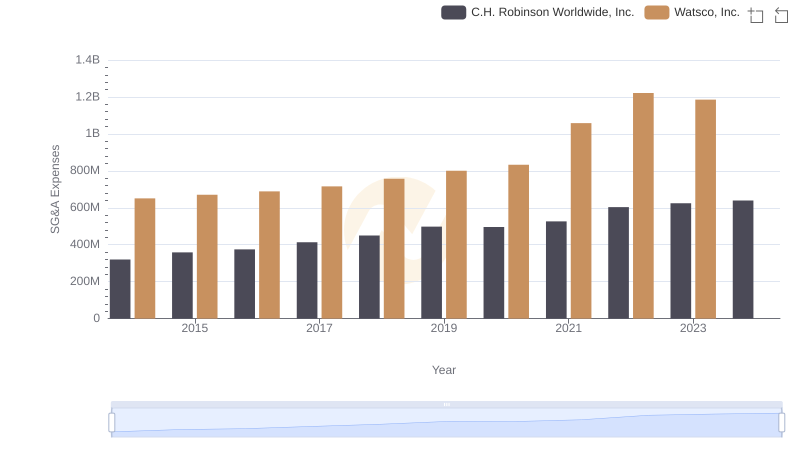
Watsco, Inc. or C.H. Robinson Worldwide, Inc.: Who Manages SG&A Costs Better?
Operational Costs Compared: SG&A Analysis of Watsco, Inc. and Clean Harbors, Inc.
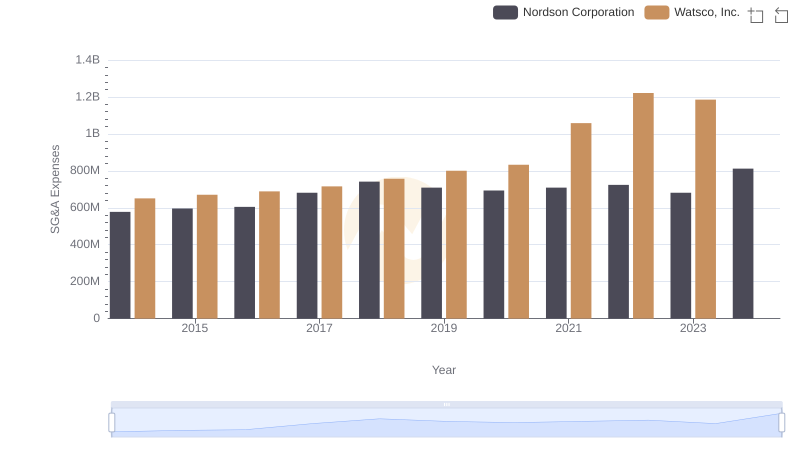
Who Optimizes SG&A Costs Better? Watsco, Inc. or Nordson Corporation
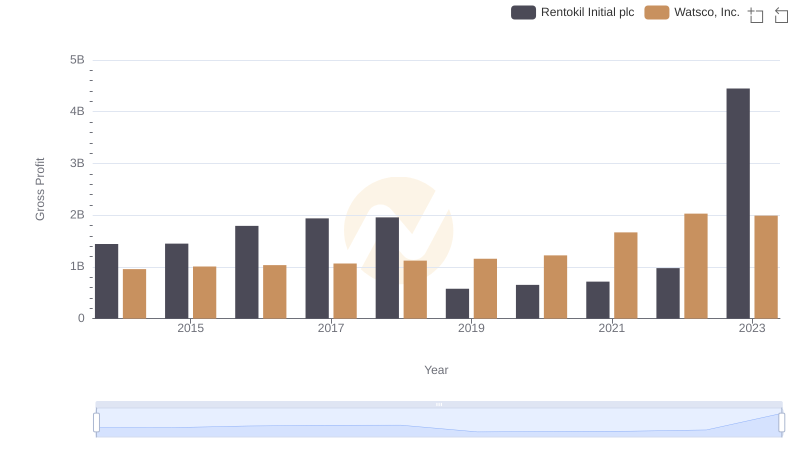
Gross Profit Trends Compared: Watsco, Inc. vs Rentokil Initial plc
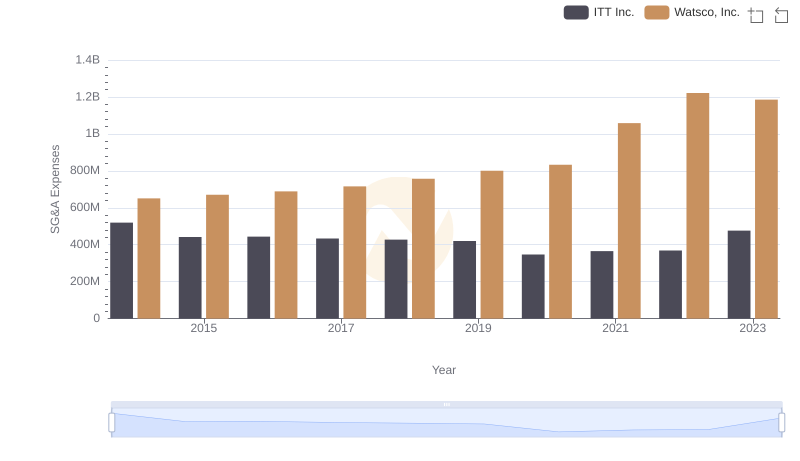
Watsco, Inc. or ITT Inc.: Who Manages SG&A Costs Better?
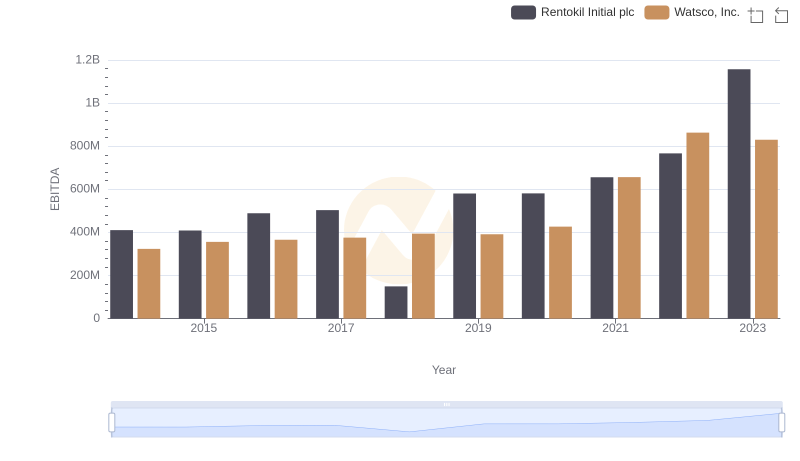
A Side-by-Side Analysis of EBITDA: Watsco, Inc. and Rentokil Initial plc