| __timestamp | Nordson Corporation | Watsco, Inc. |
|---|---|---|
| Wednesday, January 1, 2014 | 945098000 | 956402000 |
| Thursday, January 1, 2015 | 913964000 | 1007357000 |
| Friday, January 1, 2016 | 993499000 | 1034584000 |
| Sunday, January 1, 2017 | 1139001000 | 1065659000 |
| Monday, January 1, 2018 | 1235965000 | 1120252000 |
| Tuesday, January 1, 2019 | 1192103000 | 1156956000 |
| Wednesday, January 1, 2020 | 1130468000 | 1222821000 |
| Friday, January 1, 2021 | 1324080000 | 1667545000 |
| Saturday, January 1, 2022 | 1426536000 | 2030289000 |
| Sunday, January 1, 2023 | 1425405000 | 1992140000 |
| Monday, January 1, 2024 | 1486129000 | 2044713000 |
Infusing magic into the data realm
In the ever-evolving landscape of industrial giants, Watsco, Inc. and Nordson Corporation have consistently demonstrated robust financial performance. From 2014 to 2023, these companies have shown remarkable growth in gross profit, with Watsco, Inc. leading the charge. Notably, Watsco's gross profit surged by approximately 110% from 2014 to 2022, peaking in 2022 with a staggering 2.03 billion USD. Meanwhile, Nordson Corporation exhibited a steady upward trajectory, achieving a 57% increase over the same period, culminating in a gross profit of 1.49 billion USD in 2024.
The data reveals a compelling narrative of resilience and strategic growth, with Watsco, Inc. consistently outperforming Nordson Corporation. However, the absence of data for Watsco in 2024 leaves room for speculation about future trends. This analysis underscores the dynamic nature of the industrial sector and the importance of strategic financial planning.
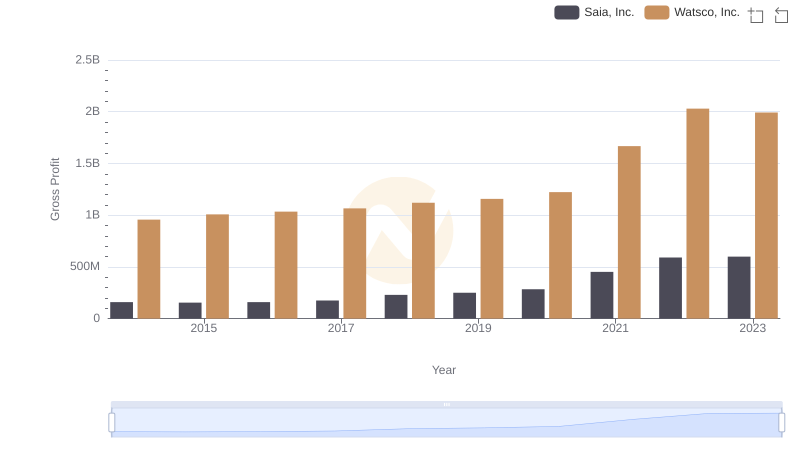
Gross Profit Analysis: Comparing Watsco, Inc. and Saia, Inc.
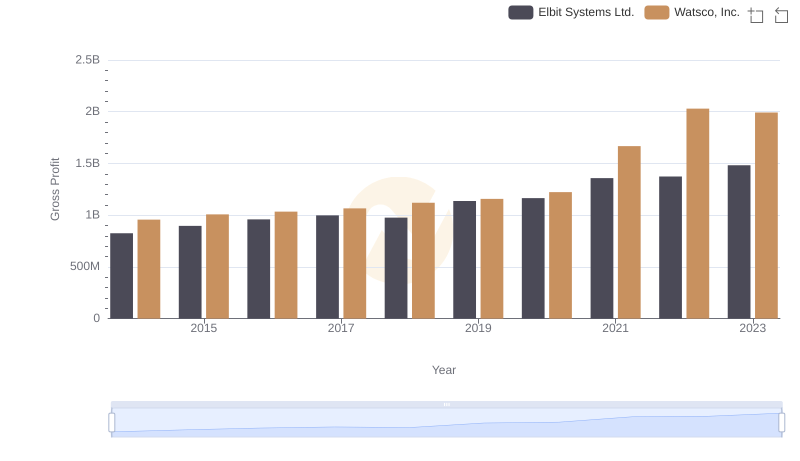
Gross Profit Analysis: Comparing Watsco, Inc. and Elbit Systems Ltd.
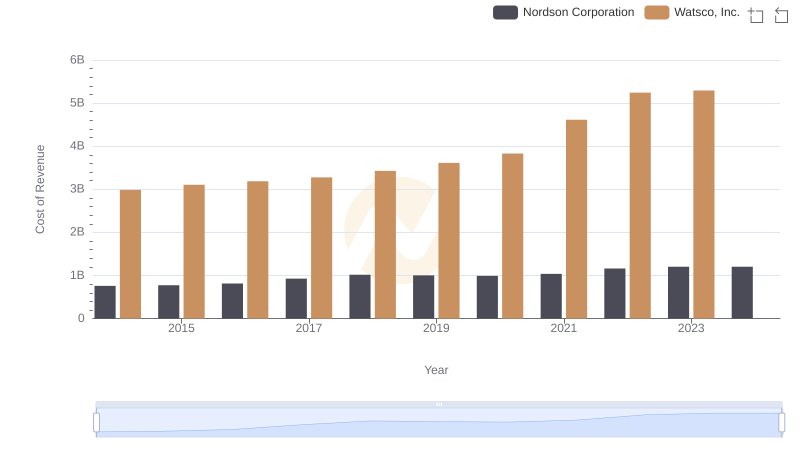
Analyzing Cost of Revenue: Watsco, Inc. and Nordson Corporation

Gross Profit Comparison: Watsco, Inc. and Curtiss-Wright Corporation Trends
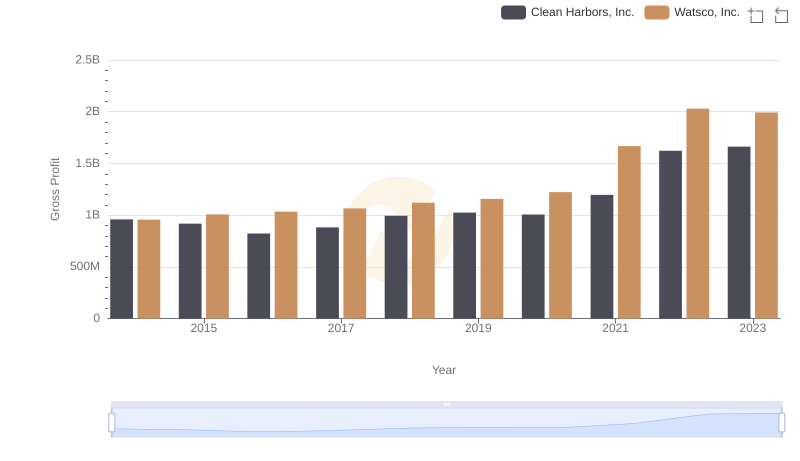
Gross Profit Trends Compared: Watsco, Inc. vs Clean Harbors, Inc.
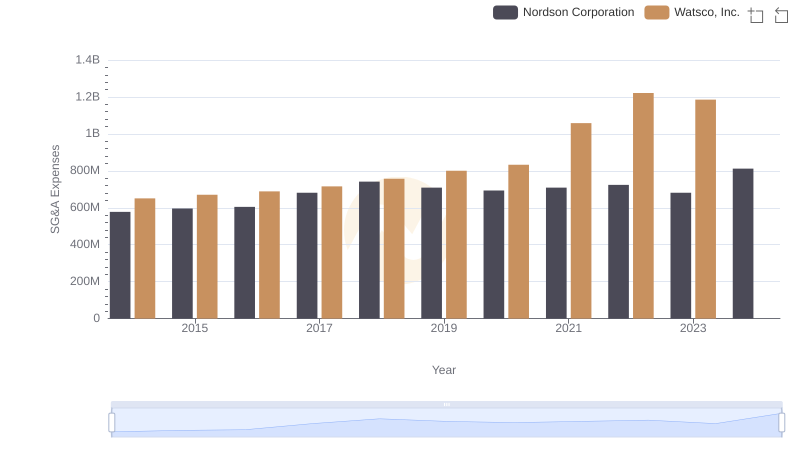
Who Optimizes SG&A Costs Better? Watsco, Inc. or Nordson Corporation
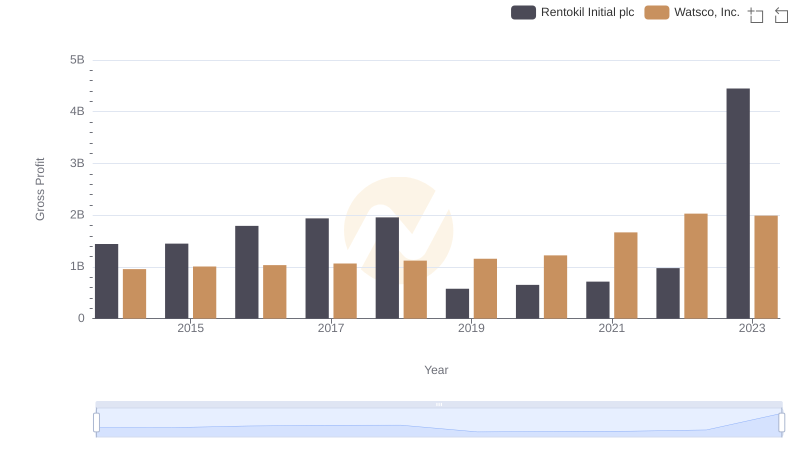
Gross Profit Trends Compared: Watsco, Inc. vs Rentokil Initial plc
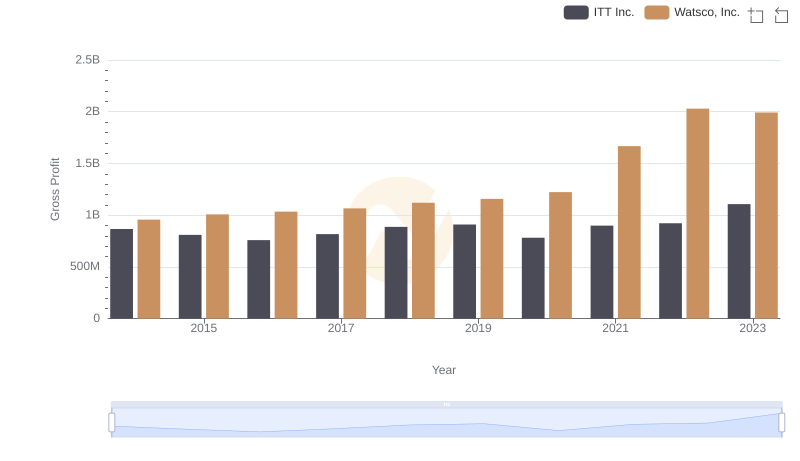
Key Insights on Gross Profit: Watsco, Inc. vs ITT Inc.
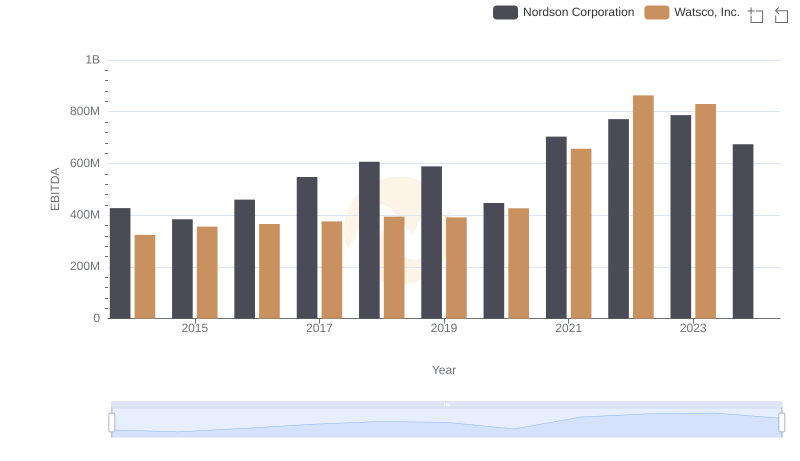
A Side-by-Side Analysis of EBITDA: Watsco, Inc. and Nordson Corporation