| __timestamp | Rentokil Initial plc | Watsco, Inc. |
|---|---|---|
| Wednesday, January 1, 2014 | 1443300000 | 956402000 |
| Thursday, January 1, 2015 | 1448800000 | 1007357000 |
| Friday, January 1, 2016 | 1792000000 | 1034584000 |
| Sunday, January 1, 2017 | 1937400000 | 1065659000 |
| Monday, January 1, 2018 | 1958100000 | 1120252000 |
| Tuesday, January 1, 2019 | 577200000 | 1156956000 |
| Wednesday, January 1, 2020 | 653000000 | 1222821000 |
| Friday, January 1, 2021 | 714800000 | 1667545000 |
| Saturday, January 1, 2022 | 977000000 | 2030289000 |
| Sunday, January 1, 2023 | 4448000000 | 1992140000 |
| Monday, January 1, 2024 | 2044713000 |
Unlocking the unknown
In the ever-evolving landscape of global business, understanding the financial health of companies is crucial. This analysis delves into the gross profit trends of two industry giants: Watsco, Inc., a leader in HVAC distribution, and Rentokil Initial plc, a prominent player in pest control and hygiene services.
From 2014 to 2023, Rentokil Initial plc demonstrated a remarkable growth trajectory, with its gross profit surging by over 200%, peaking in 2023. This growth reflects strategic expansions and acquisitions. In contrast, Watsco, Inc. experienced a steady increase, with a 108% rise in gross profit over the same period, showcasing resilience and consistent market demand.
The year 2023 marked a significant milestone for Rentokil, with a gross profit of approximately 4.4 billion, a testament to its robust business model. Meanwhile, Watsco's gross profit reached nearly 2 billion, underscoring its strong market position.
These insights highlight the dynamic nature of these industries and the strategic maneuvers that drive financial success.
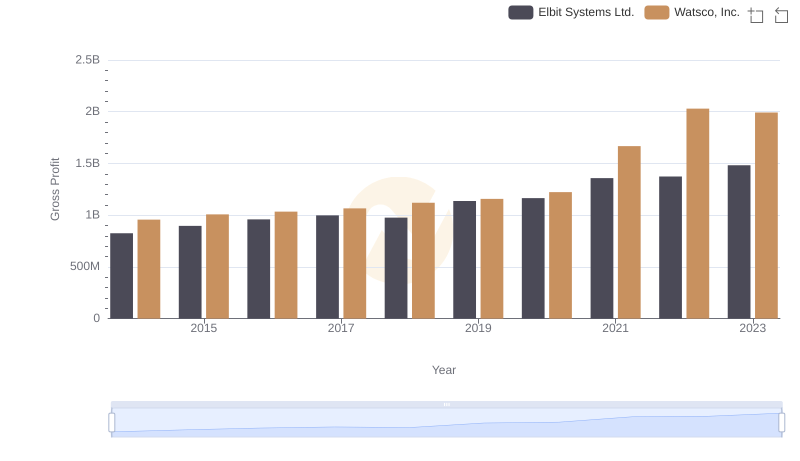
Gross Profit Analysis: Comparing Watsco, Inc. and Elbit Systems Ltd.

Gross Profit Comparison: Watsco, Inc. and Curtiss-Wright Corporation Trends
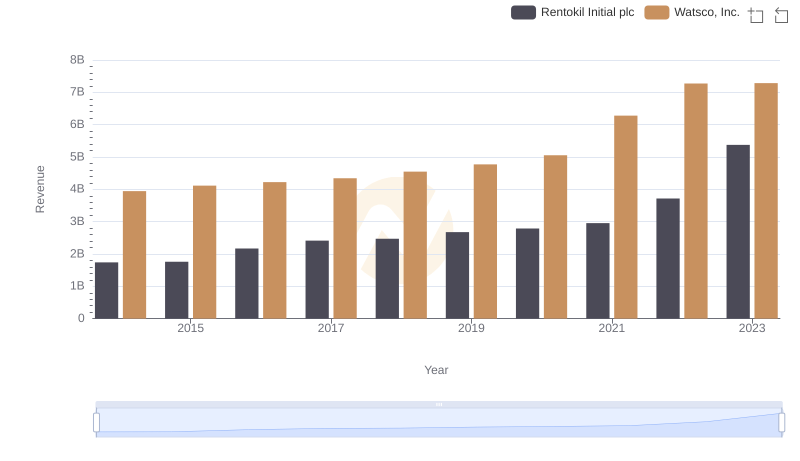
Watsco, Inc. and Rentokil Initial plc: A Comprehensive Revenue Analysis
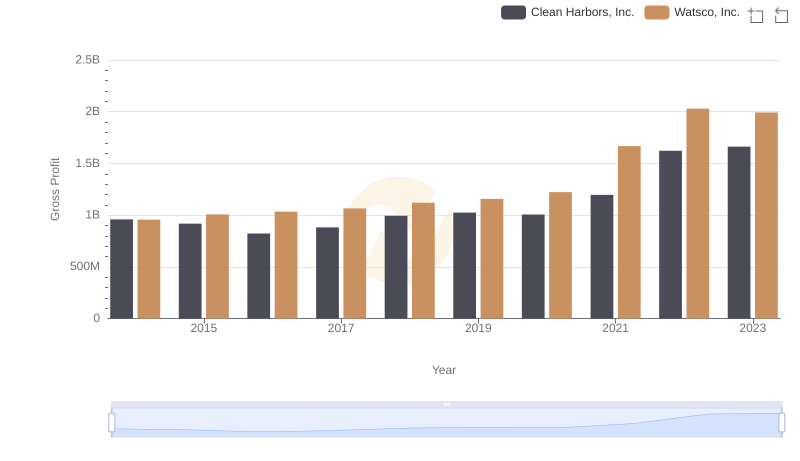
Gross Profit Trends Compared: Watsco, Inc. vs Clean Harbors, Inc.
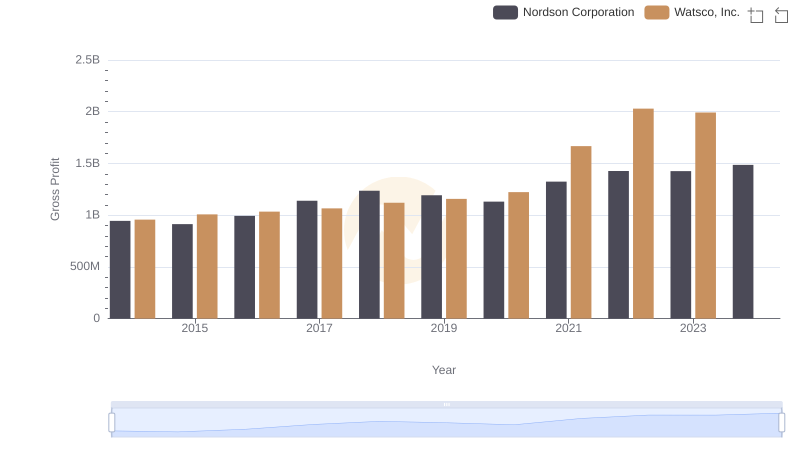
Watsco, Inc. and Nordson Corporation: A Detailed Gross Profit Analysis
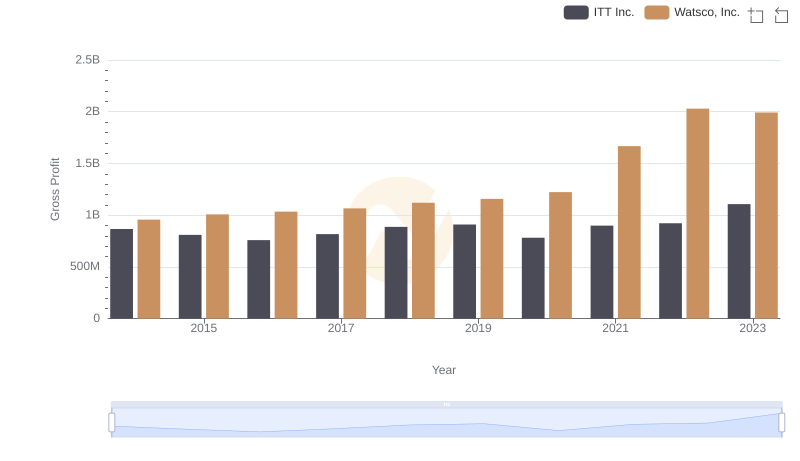
Key Insights on Gross Profit: Watsco, Inc. vs ITT Inc.
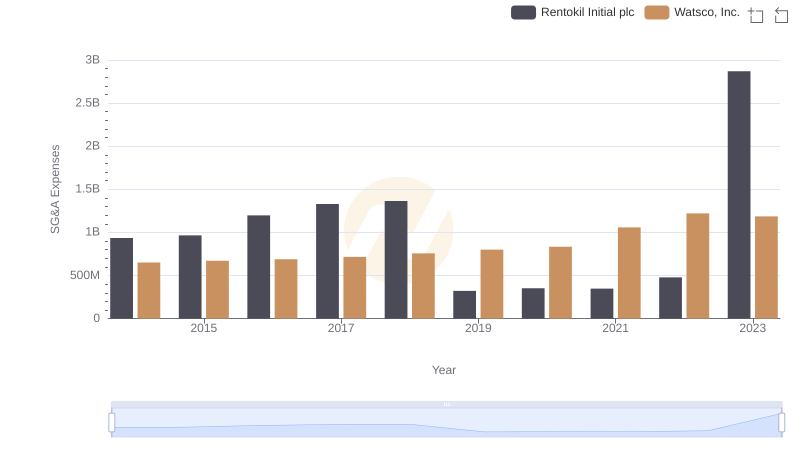
SG&A Efficiency Analysis: Comparing Watsco, Inc. and Rentokil Initial plc
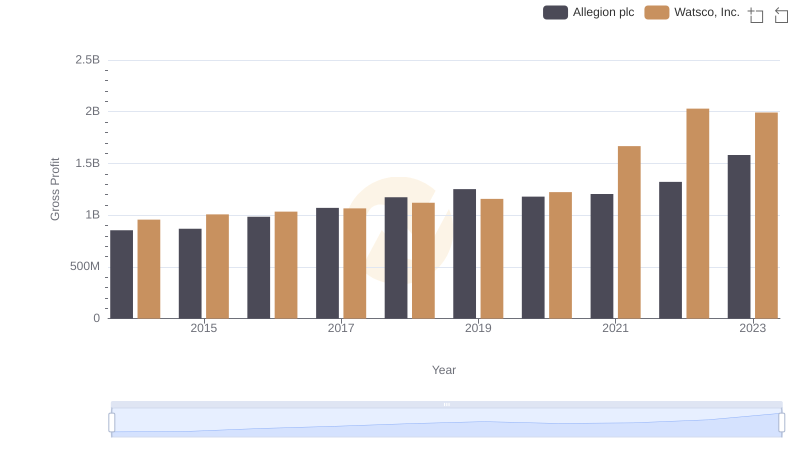
Who Generates Higher Gross Profit? Watsco, Inc. or Allegion plc
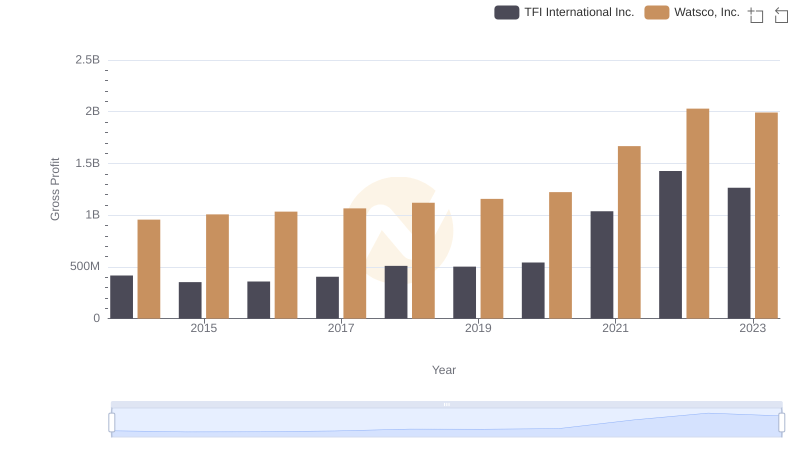
Key Insights on Gross Profit: Watsco, Inc. vs TFI International Inc.
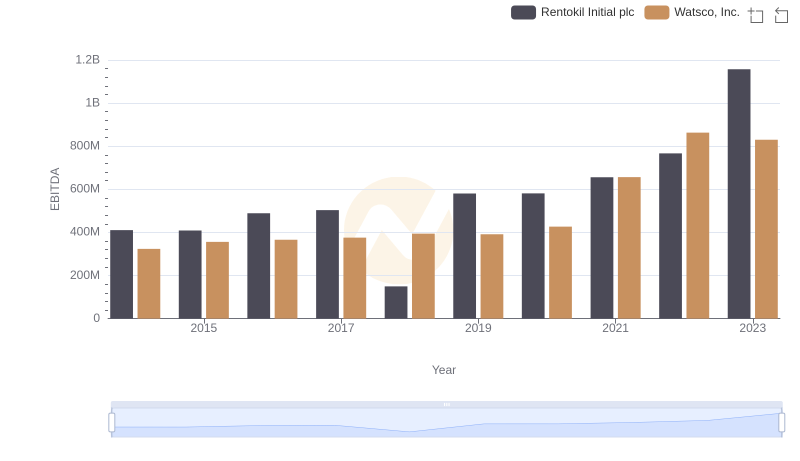
A Side-by-Side Analysis of EBITDA: Watsco, Inc. and Rentokil Initial plc