| __timestamp | Clean Harbors, Inc. | Watsco, Inc. |
|---|---|---|
| Wednesday, January 1, 2014 | 959840000 | 956402000 |
| Thursday, January 1, 2015 | 918331000 | 1007357000 |
| Friday, January 1, 2016 | 822369000 | 1034584000 |
| Sunday, January 1, 2017 | 882305000 | 1065659000 |
| Monday, January 1, 2018 | 994752000 | 1120252000 |
| Tuesday, January 1, 2019 | 1024371000 | 1156956000 |
| Wednesday, January 1, 2020 | 1006346000 | 1222821000 |
| Friday, January 1, 2021 | 1195729000 | 1667545000 |
| Saturday, January 1, 2022 | 1622675000 | 2030289000 |
| Sunday, January 1, 2023 | 1663028000 | 1992140000 |
| Monday, January 1, 2024 | 1824239000 | 2044713000 |
Data in motion
In the competitive landscape of industrial services and HVAC distribution, Clean Harbors, Inc. and Watsco, Inc. have shown intriguing gross profit trends over the past decade. From 2014 to 2023, Watsco, Inc. consistently outperformed Clean Harbors, Inc., with a notable peak in 2022, where Watsco's gross profit was approximately 25% higher than Clean Harbors'. This trend highlights Watsco's robust growth strategy and market positioning. Clean Harbors, however, demonstrated a remarkable recovery post-2020, with a 65% increase in gross profit by 2023, showcasing resilience and adaptability in a challenging market. These trends underscore the dynamic nature of the industrial sector, where strategic pivots and market demands shape financial outcomes. As we look to the future, the question remains: will Clean Harbors continue its upward trajectory, or will Watsco maintain its lead?
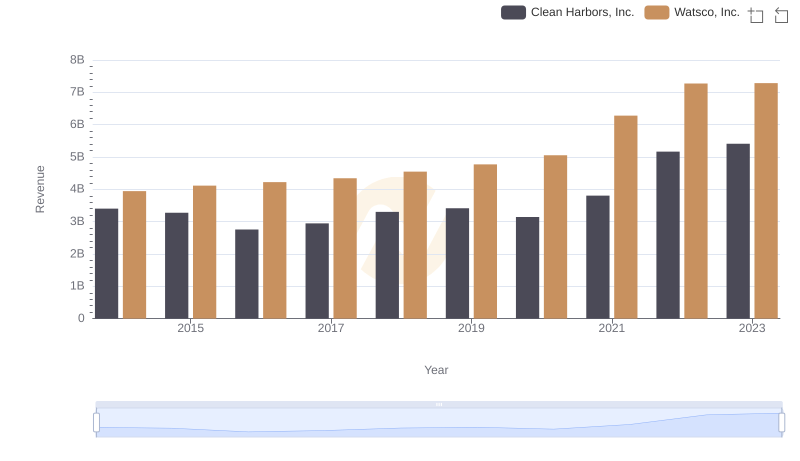
Watsco, Inc. vs Clean Harbors, Inc.: Annual Revenue Growth Compared
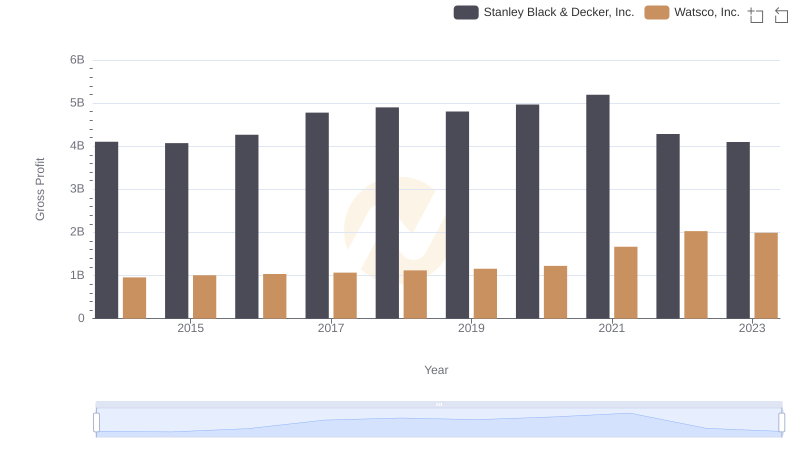
Gross Profit Trends Compared: Watsco, Inc. vs Stanley Black & Decker, Inc.
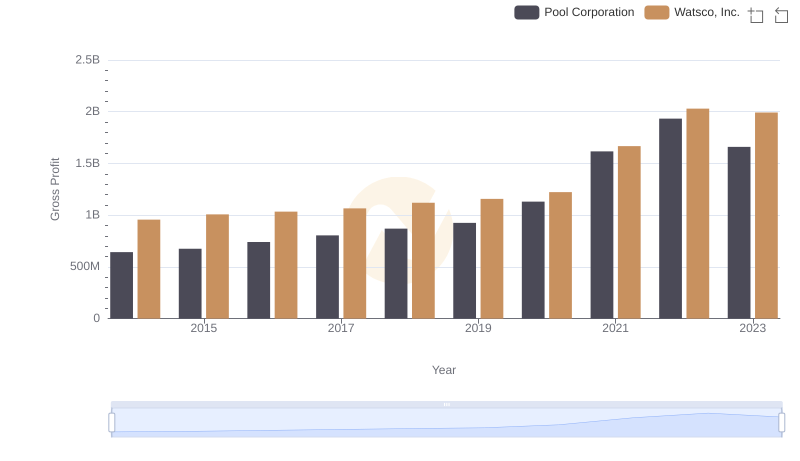
Watsco, Inc. and Pool Corporation: A Detailed Gross Profit Analysis
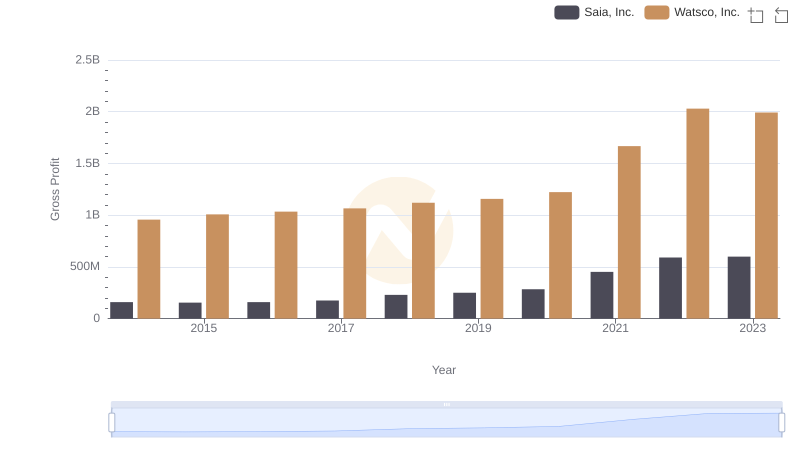
Gross Profit Analysis: Comparing Watsco, Inc. and Saia, Inc.
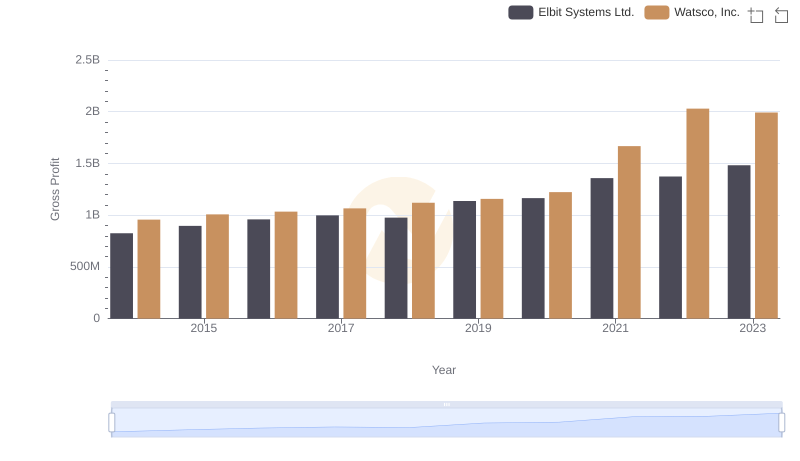
Gross Profit Analysis: Comparing Watsco, Inc. and Elbit Systems Ltd.

Gross Profit Comparison: Watsco, Inc. and Curtiss-Wright Corporation Trends
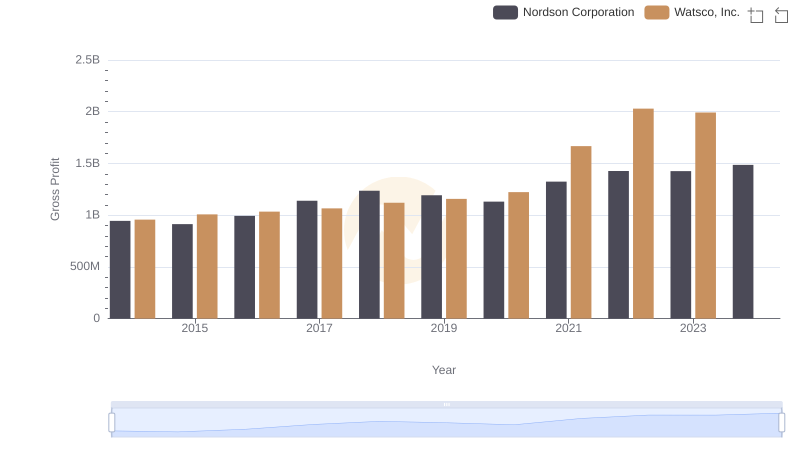
Watsco, Inc. and Nordson Corporation: A Detailed Gross Profit Analysis
Operational Costs Compared: SG&A Analysis of Watsco, Inc. and Clean Harbors, Inc.
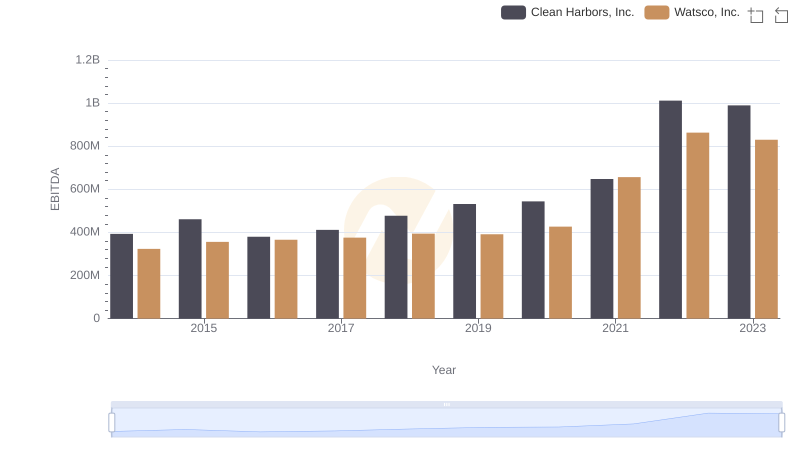
A Side-by-Side Analysis of EBITDA: Watsco, Inc. and Clean Harbors, Inc.