| __timestamp | RB Global, Inc. | Waste Management, Inc. |
|---|---|---|
| Wednesday, January 1, 2014 | 57884000 | 9002000000 |
| Thursday, January 1, 2015 | 56026000 | 8231000000 |
| Friday, January 1, 2016 | 66062000 | 8486000000 |
| Sunday, January 1, 2017 | 79013000 | 9021000000 |
| Monday, January 1, 2018 | 533397000 | 9249000000 |
| Tuesday, January 1, 2019 | 645816000 | 9496000000 |
| Wednesday, January 1, 2020 | 615589000 | 9341000000 |
| Friday, January 1, 2021 | 594783000 | 11111000000 |
| Saturday, January 1, 2022 | 776701000 | 12294000000 |
| Sunday, January 1, 2023 | 1901200000 | 12606000000 |
| Monday, January 1, 2024 | 0 | 13383000000 |
Igniting the spark of knowledge
In the ever-evolving landscape of waste management and global asset management, understanding cost structures is crucial. Over the past decade, Waste Management, Inc. has consistently demonstrated a robust cost of revenue, peaking at approximately $12.6 billion in 2023. This represents a 40% increase from 2014, showcasing their strategic growth and operational efficiency. In contrast, RB Global, Inc. has experienced a more volatile trajectory, with a significant surge in 2023, reaching nearly $1.9 billion, a staggering 3,200% increase from 2014. This dramatic rise highlights RB Global's aggressive expansion and adaptation strategies. The data underscores the importance of cost management in maintaining competitive advantage and profitability in these industries. As we look to the future, these trends offer valuable insights into the financial health and strategic direction of these key players.
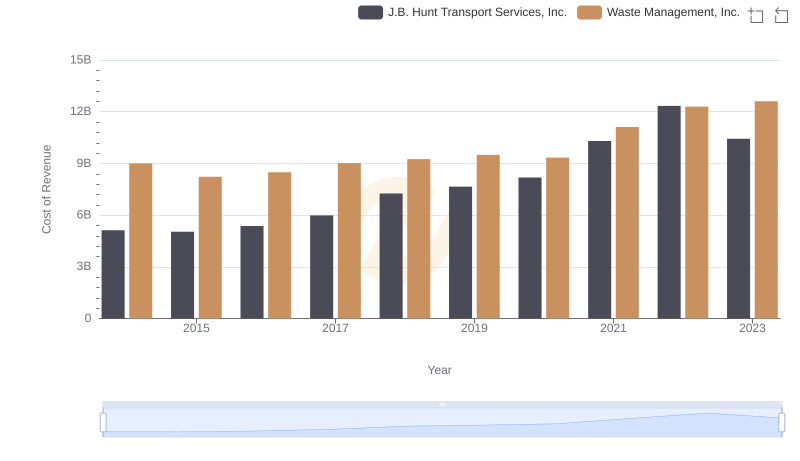
Cost of Revenue Trends: Waste Management, Inc. vs J.B. Hunt Transport Services, Inc.
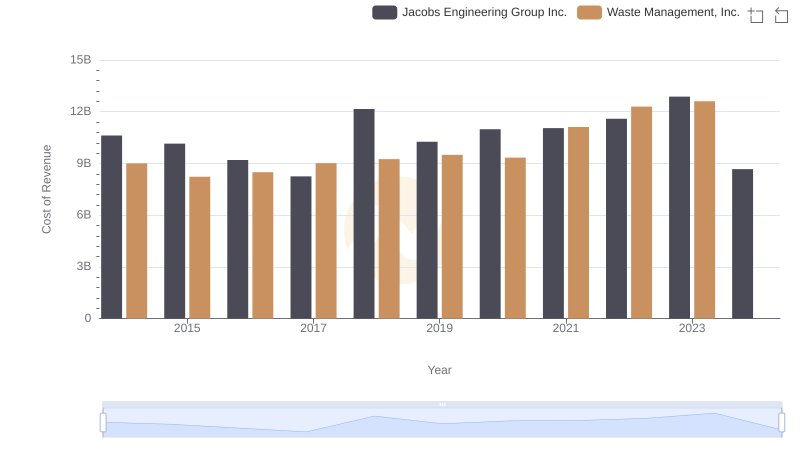
Cost of Revenue: Key Insights for Waste Management, Inc. and Jacobs Engineering Group Inc.
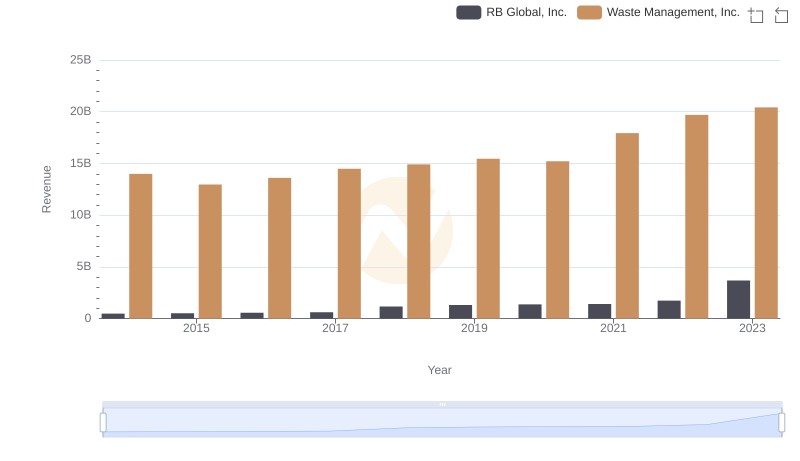
Revenue Showdown: Waste Management, Inc. vs RB Global, Inc.
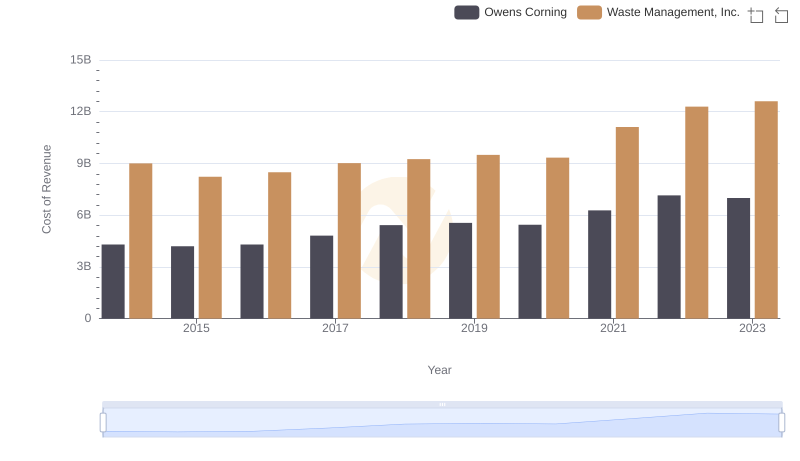
Comparing Cost of Revenue Efficiency: Waste Management, Inc. vs Owens Corning
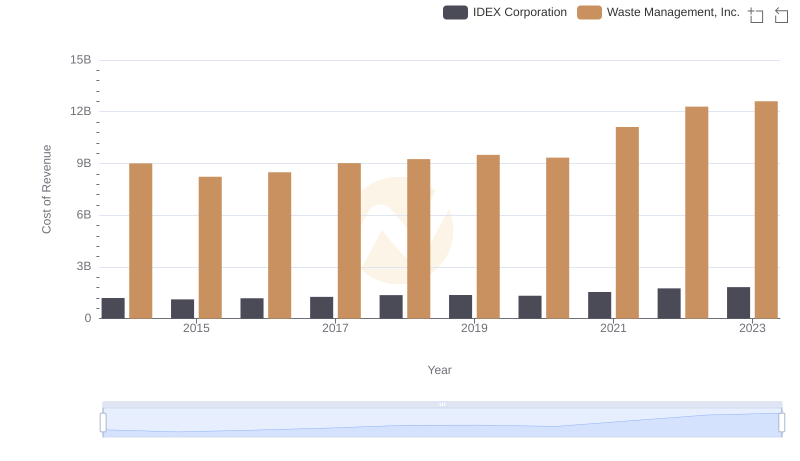
Comparing Cost of Revenue Efficiency: Waste Management, Inc. vs IDEX Corporation
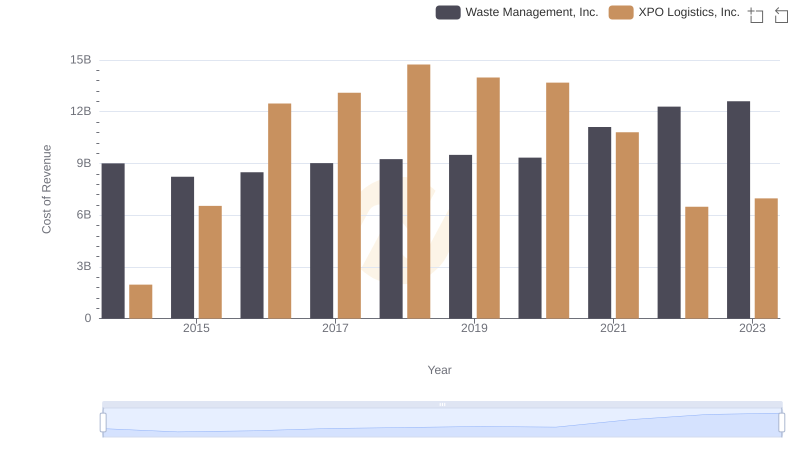
Cost of Revenue: Key Insights for Waste Management, Inc. and XPO Logistics, Inc.
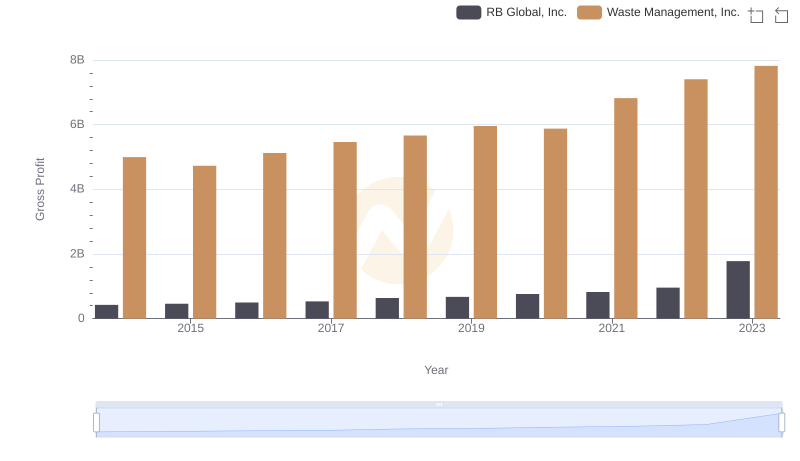
Gross Profit Comparison: Waste Management, Inc. and RB Global, Inc. Trends
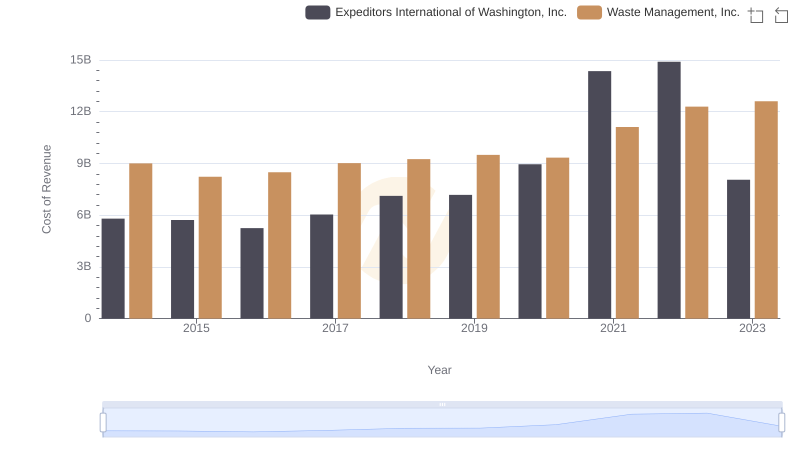
Waste Management, Inc. vs Expeditors International of Washington, Inc.: Efficiency in Cost of Revenue Explored

Cost of Revenue: Key Insights for Waste Management, Inc. and China Eastern Airlines Corporation Limited
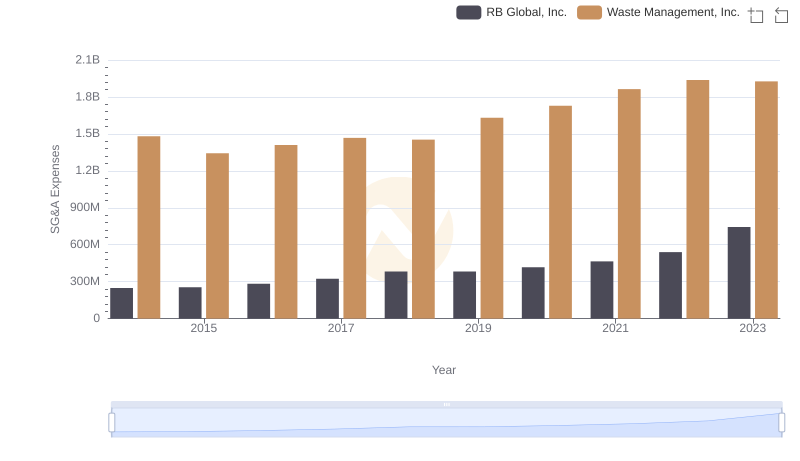
Cost Management Insights: SG&A Expenses for Waste Management, Inc. and RB Global, Inc.
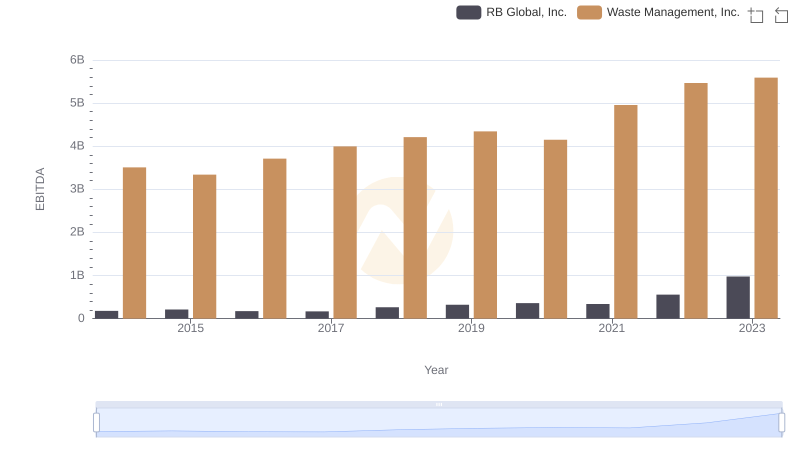
Waste Management, Inc. vs RB Global, Inc.: In-Depth EBITDA Performance Comparison