| __timestamp | Ingersoll Rand Inc. | Waste Management, Inc. |
|---|---|---|
| Wednesday, January 1, 2014 | 2570005000 | 13996000000 |
| Thursday, January 1, 2015 | 2126900000 | 12961000000 |
| Friday, January 1, 2016 | 1939436000 | 13609000000 |
| Sunday, January 1, 2017 | 2375400000 | 14485000000 |
| Monday, January 1, 2018 | 2689800000 | 14914000000 |
| Tuesday, January 1, 2019 | 2451900000 | 15455000000 |
| Wednesday, January 1, 2020 | 4910200000 | 15218000000 |
| Friday, January 1, 2021 | 5152400000 | 17931000000 |
| Saturday, January 1, 2022 | 5916300000 | 19698000000 |
| Sunday, January 1, 2023 | 6876100000 | 20426000000 |
| Monday, January 1, 2024 | 0 | 22063000000 |
Cracking the code
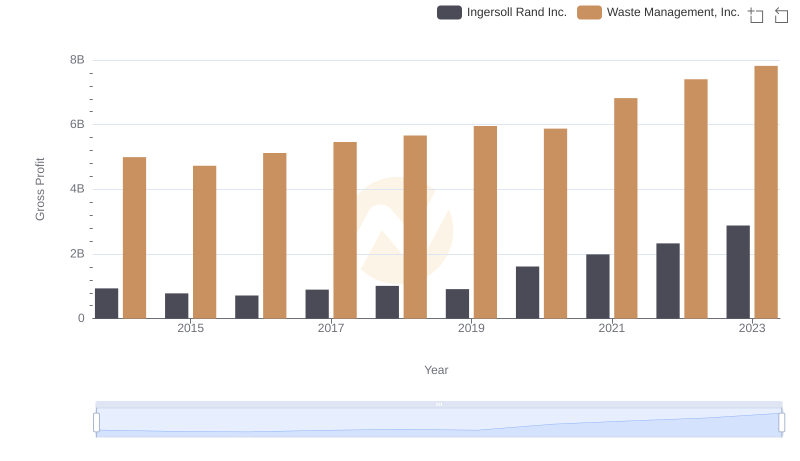
In the ever-evolving landscape of industrial giants, Waste Management, Inc. and Ingersoll Rand Inc. have showcased remarkable revenue trajectories over the past decade. From 2014 to 2023, Waste Management, Inc. consistently outperformed, with revenues soaring from approximately $14 billion to over $20 billion, marking a robust 46% increase. This growth underscores the company's strategic expansion and adaptation to environmental demands.
Conversely, Ingersoll Rand Inc. experienced a significant revenue surge, particularly post-2020, with a 178% increase from $2 billion in 2016 to nearly $7 billion in 2023. This leap highlights the company's successful diversification and innovation in industrial solutions.
The data reveals a compelling narrative of resilience and strategic foresight, as both companies navigate the complexities of their respective industries, setting benchmarks for future growth and sustainability.
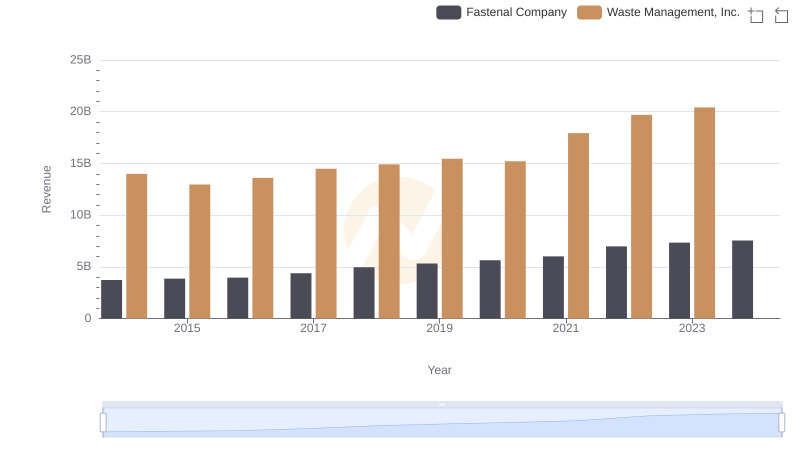
Waste Management, Inc. vs Fastenal Company: Examining Key Revenue Metrics
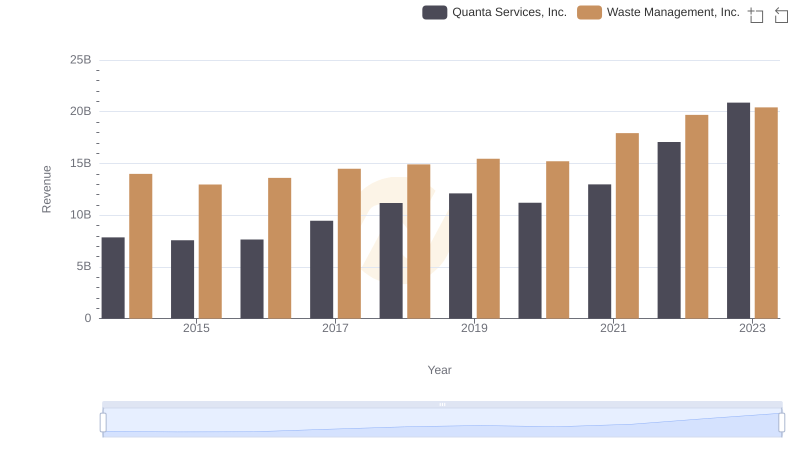
Waste Management, Inc. and Quanta Services, Inc.: A Comprehensive Revenue Analysis
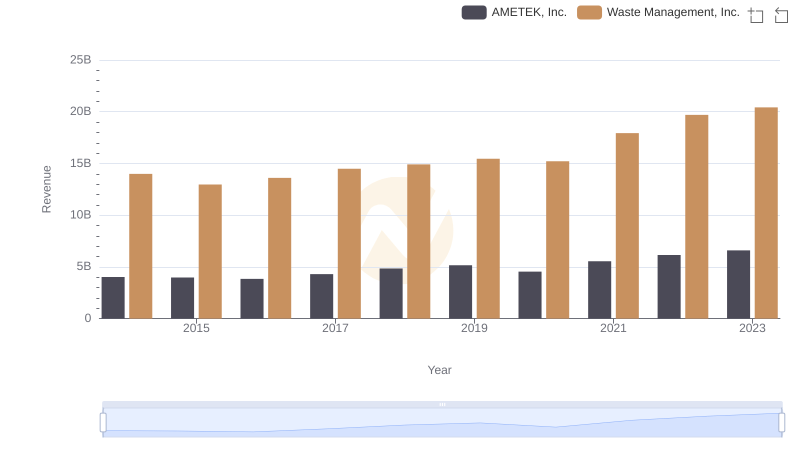
Waste Management, Inc. and AMETEK, Inc.: A Comprehensive Revenue Analysis
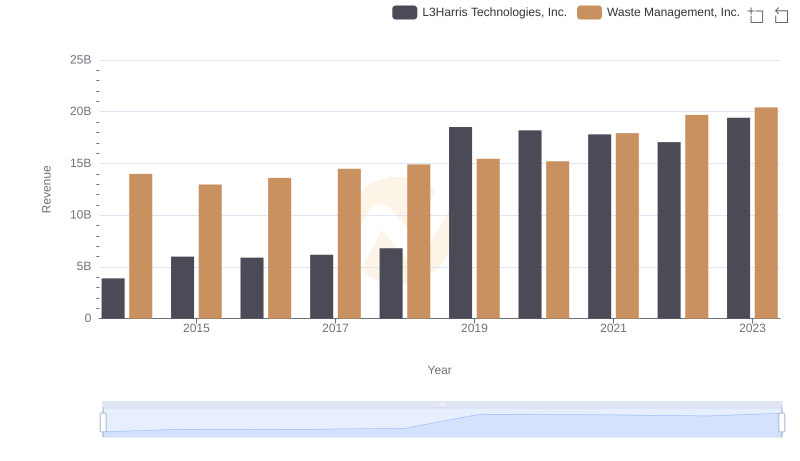
Waste Management, Inc. vs L3Harris Technologies, Inc.: Annual Revenue Growth Compared

Revenue Showdown: Waste Management, Inc. vs Old Dominion Freight Line, Inc.
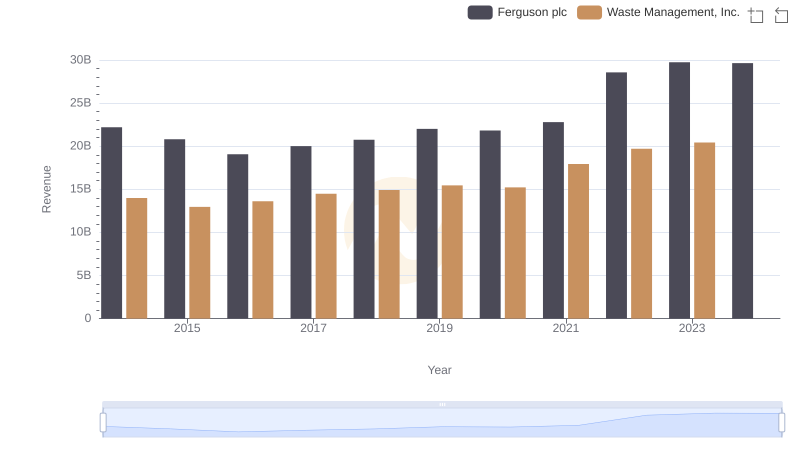
Revenue Insights: Waste Management, Inc. and Ferguson plc Performance Compared
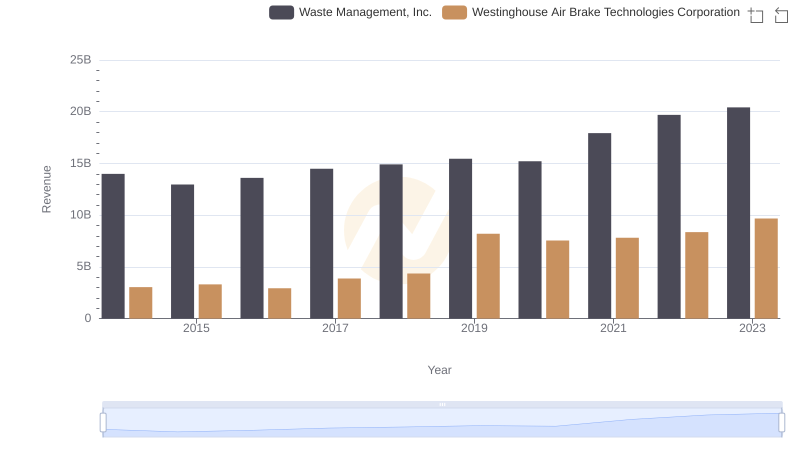
Revenue Showdown: Waste Management, Inc. vs Westinghouse Air Brake Technologies Corporation
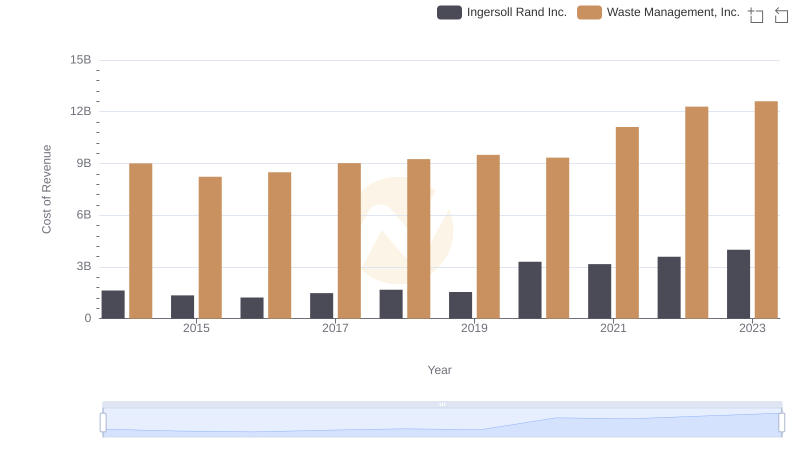
Cost of Revenue Comparison: Waste Management, Inc. vs Ingersoll Rand Inc.
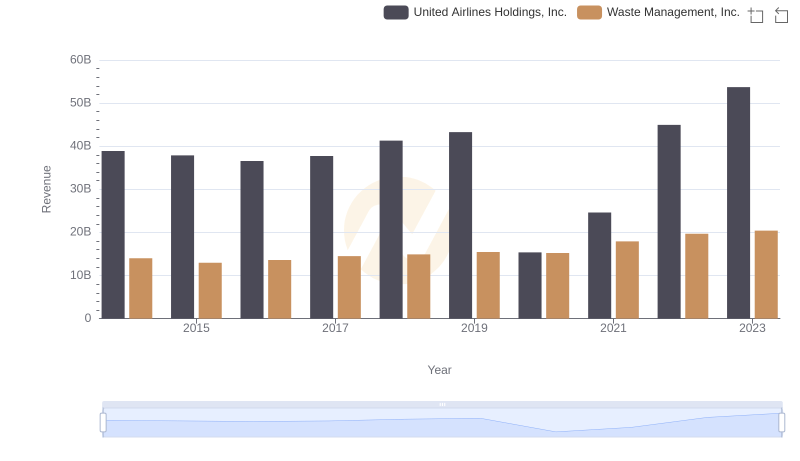
Waste Management, Inc. and United Airlines Holdings, Inc.: A Comprehensive Revenue Analysis
Key Insights on Gross Profit: Waste Management, Inc. vs Ingersoll Rand Inc.

Comparing SG&A Expenses: Waste Management, Inc. vs Ingersoll Rand Inc. Trends and Insights