| __timestamp | Waste Connections, Inc. | Waste Management, Inc. |
|---|---|---|
| Wednesday, January 1, 2014 | 940778000 | 4994000000 |
| Thursday, January 1, 2015 | 939878000 | 4730000000 |
| Friday, January 1, 2016 | 1418151000 | 5123000000 |
| Sunday, January 1, 2017 | 1925713000 | 5464000000 |
| Monday, January 1, 2018 | 2057237000 | 5665000000 |
| Tuesday, January 1, 2019 | 2189922000 | 5959000000 |
| Wednesday, January 1, 2020 | 2169182000 | 5877000000 |
| Friday, January 1, 2021 | 2497287000 | 6820000000 |
| Saturday, January 1, 2022 | 2875847000 | 7404000000 |
| Sunday, January 1, 2023 | 3277438000 | 7820000000 |
| Monday, January 1, 2024 | 3727885000 | 8680000000 |
Infusing magic into the data realm
In the past decade, Waste Management, Inc. and Waste Connections, Inc. have demonstrated remarkable growth in their gross profits, reflecting their dominance in the waste management industry. From 2014 to 2023, Waste Management, Inc. saw its gross profit soar by approximately 57%, reaching a peak in 2023. Meanwhile, Waste Connections, Inc. experienced an impressive 248% increase over the same period, showcasing its rapid expansion and strategic market positioning.
The data reveals that Waste Management, Inc. consistently maintained a higher gross profit, averaging around 5.99 billion annually, compared to Waste Connections, Inc.'s 2.03 billion. However, the latter's growth trajectory suggests a narrowing gap, with its 2023 gross profit reaching nearly half of Waste Management, Inc.'s. This trend highlights the competitive landscape and the potential for further shifts in market leadership.
As the industry evolves, these companies' financial performances will be pivotal in shaping the future of waste management.
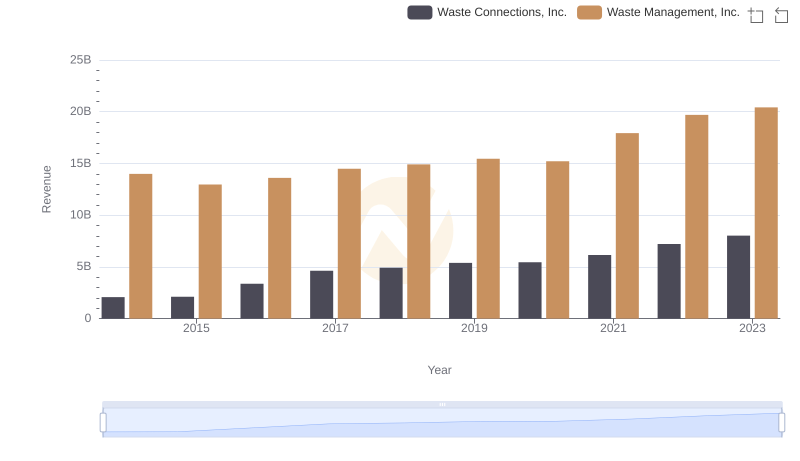
Who Generates More Revenue? Waste Management, Inc. or Waste Connections, Inc.
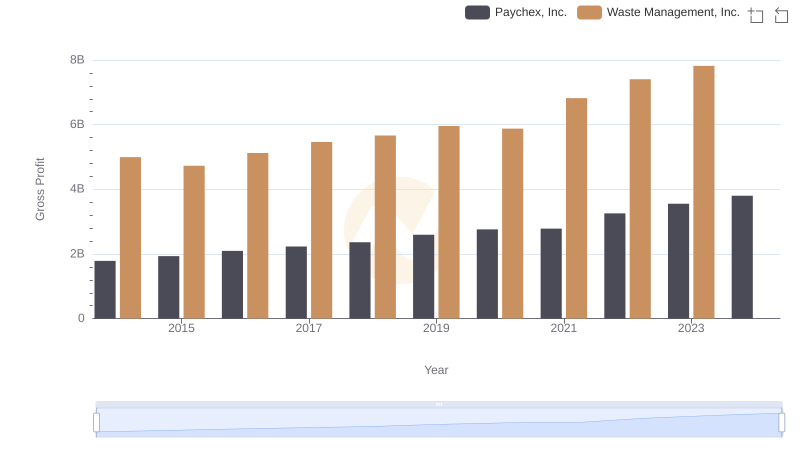
Gross Profit Comparison: Waste Management, Inc. and Paychex, Inc. Trends
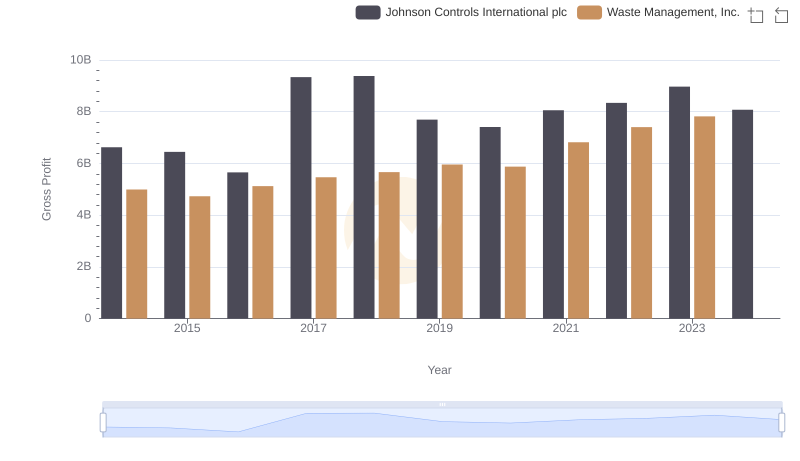
Waste Management, Inc. and Johnson Controls International plc: A Detailed Gross Profit Analysis
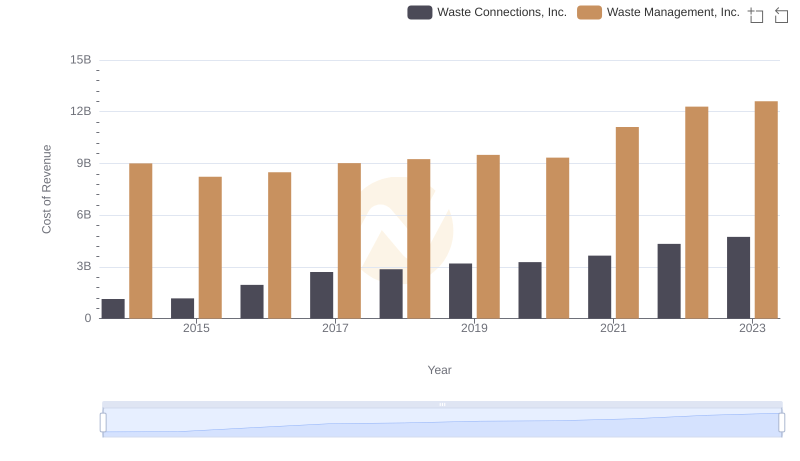
Waste Management, Inc. vs Waste Connections, Inc.: Efficiency in Cost of Revenue Explored
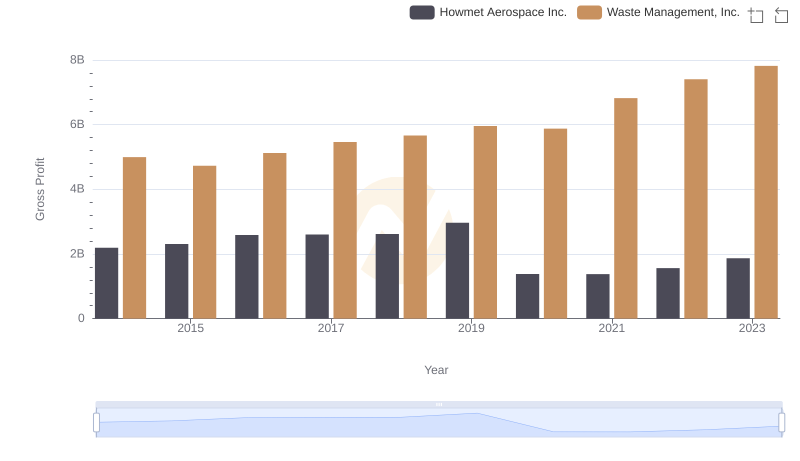
Gross Profit Comparison: Waste Management, Inc. and Howmet Aerospace Inc. Trends
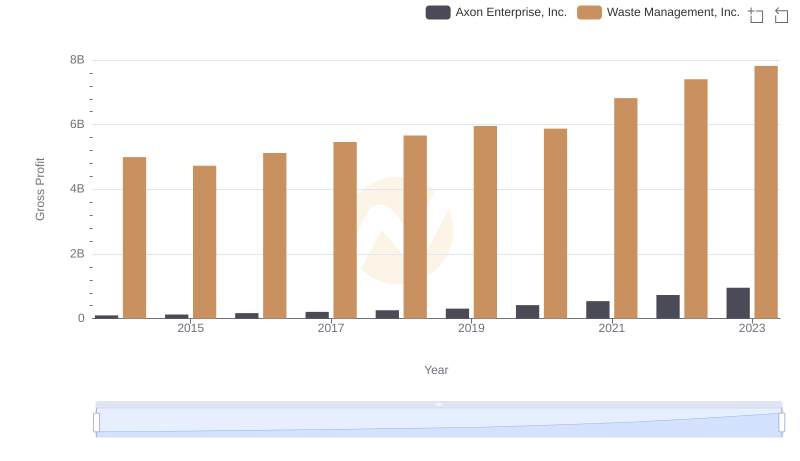
Gross Profit Comparison: Waste Management, Inc. and Axon Enterprise, Inc. Trends
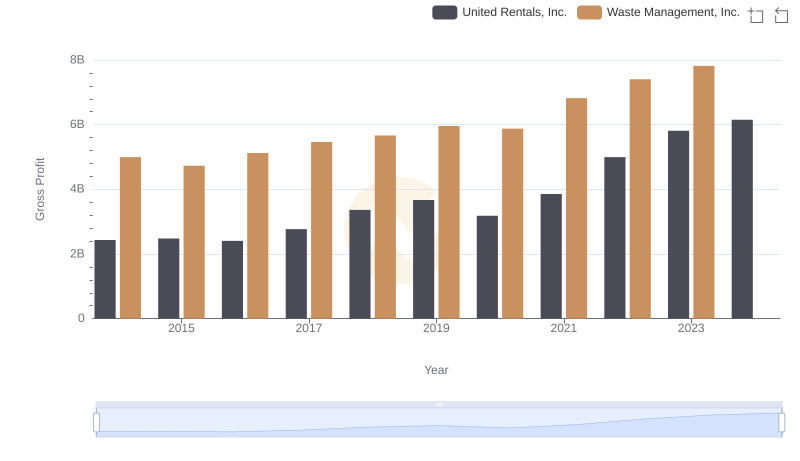
Who Generates Higher Gross Profit? Waste Management, Inc. or United Rentals, Inc.
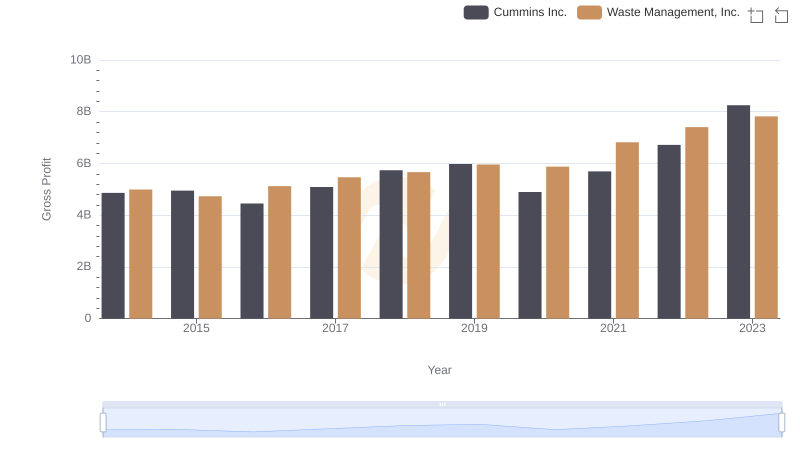
Who Generates Higher Gross Profit? Waste Management, Inc. or Cummins Inc.
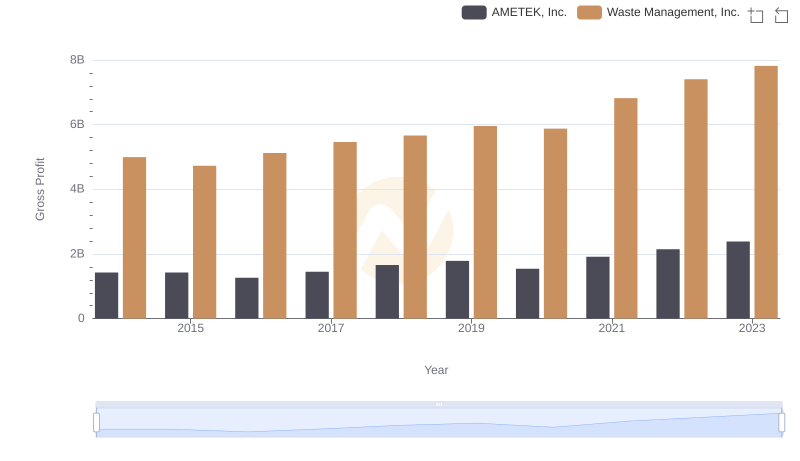
Waste Management, Inc. and AMETEK, Inc.: A Detailed Gross Profit Analysis
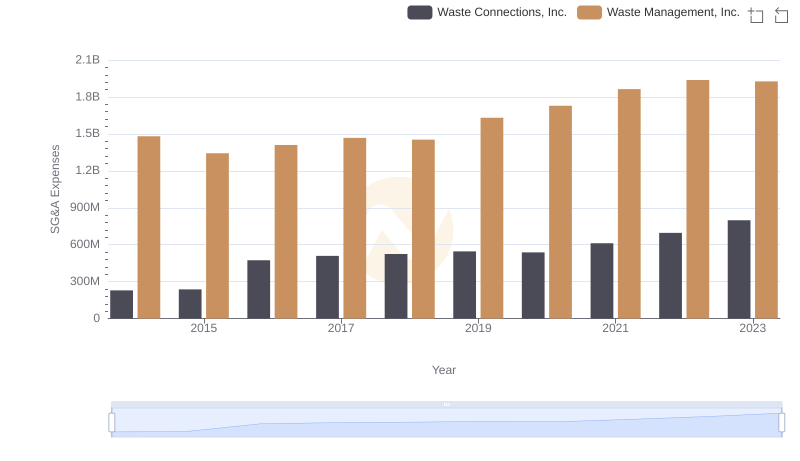
SG&A Efficiency Analysis: Comparing Waste Management, Inc. and Waste Connections, Inc.
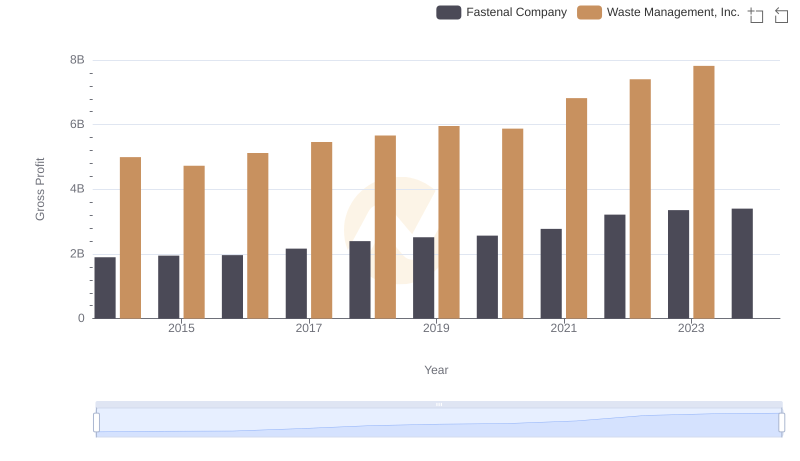
Gross Profit Trends Compared: Waste Management, Inc. vs Fastenal Company
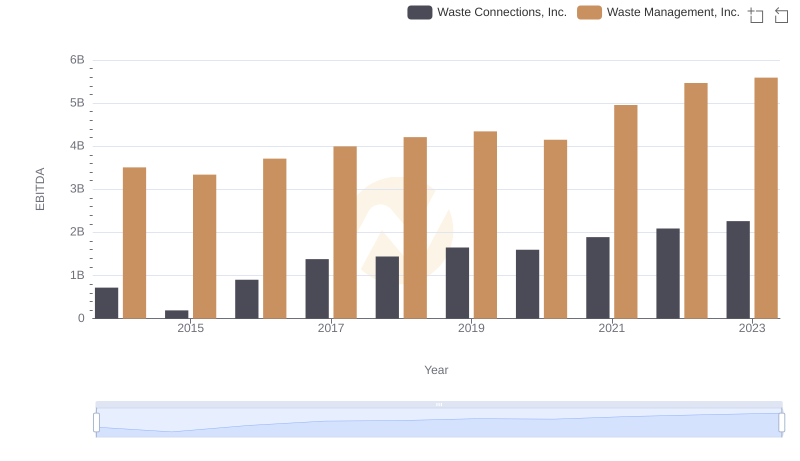
A Side-by-Side Analysis of EBITDA: Waste Management, Inc. and Waste Connections, Inc.