| __timestamp | Masco Corporation | Waste Connections, Inc. |
|---|---|---|
| Wednesday, January 1, 2014 | 899000000 | 717805000 |
| Thursday, January 1, 2015 | 1041000000 | 191002871 |
| Friday, January 1, 2016 | 1220000000 | 900371894 |
| Sunday, January 1, 2017 | 1314000000 | 1380632000 |
| Monday, January 1, 2018 | 1240000000 | 1442229014 |
| Tuesday, January 1, 2019 | 1244000000 | 1650754605 |
| Wednesday, January 1, 2020 | 1410000000 | 1597555000 |
| Friday, January 1, 2021 | 1185000000 | 1891001000 |
| Saturday, January 1, 2022 | 1490000000 | 2090554149 |
| Sunday, January 1, 2023 | 1493000000 | 2261354000 |
| Monday, January 1, 2024 | 1410000000 | 2389779000 |
Unveiling the hidden dimensions of data
In the ever-evolving landscape of corporate finance, understanding the EBITDA trends of industry giants like Waste Connections, Inc. and Masco Corporation offers valuable insights. Over the past decade, Waste Connections, Inc. has demonstrated a robust growth trajectory, with its EBITDA surging by approximately 215% from 2014 to 2023. In contrast, Masco Corporation has shown a steadier growth pattern, with a 66% increase in the same period.
This comparative analysis underscores the dynamic nature of these corporations, highlighting Waste Connections, Inc.'s aggressive growth strategy and Masco Corporation's stable financial performance.
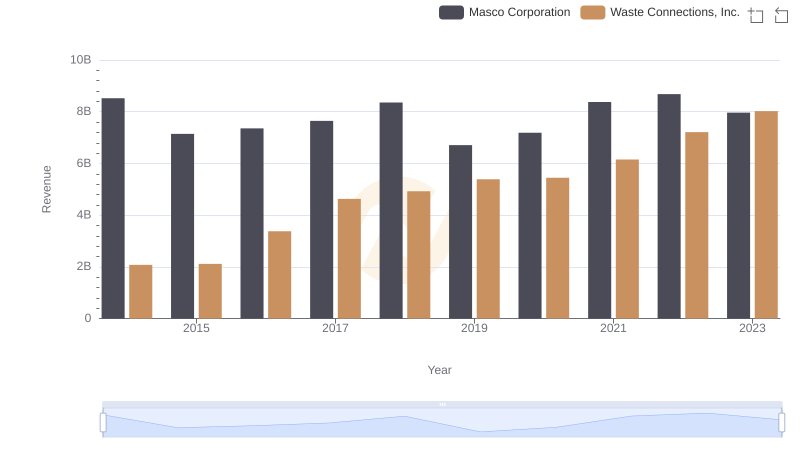
Comparing Revenue Performance: Waste Connections, Inc. or Masco Corporation?
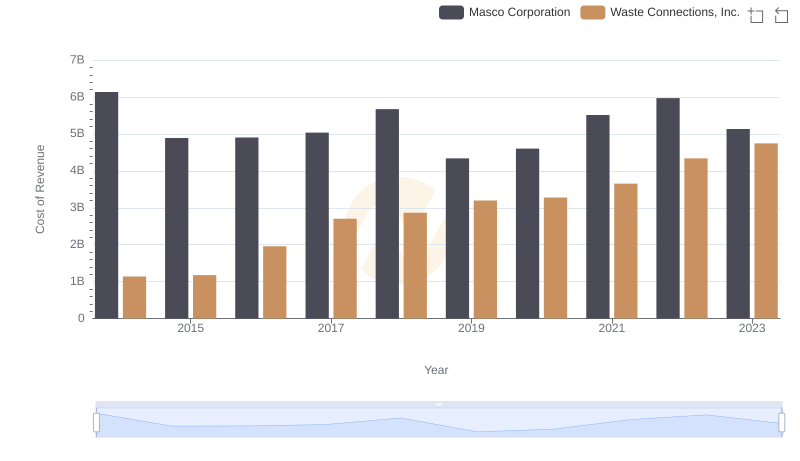
Cost of Revenue Comparison: Waste Connections, Inc. vs Masco Corporation
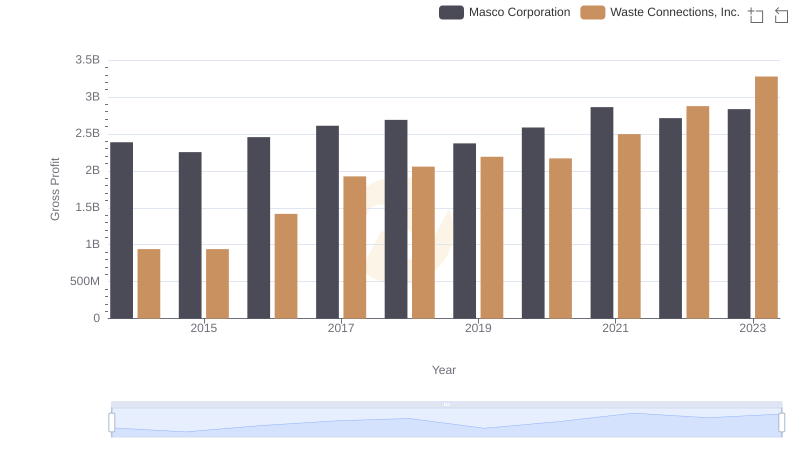
Gross Profit Trends Compared: Waste Connections, Inc. vs Masco Corporation
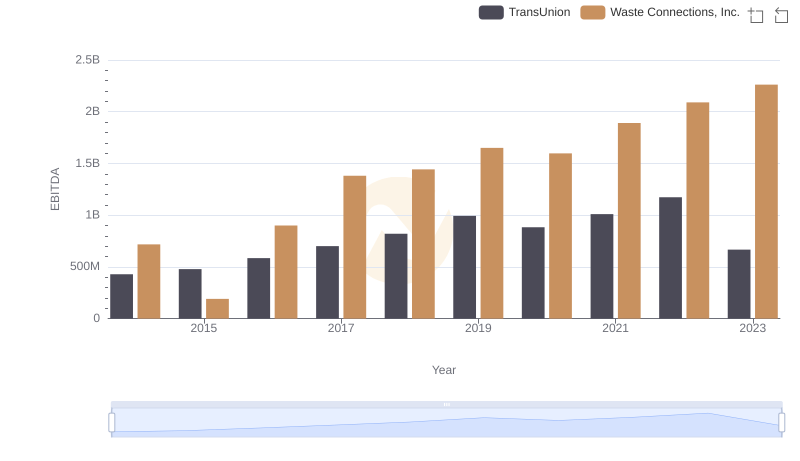
Waste Connections, Inc. vs TransUnion: In-Depth EBITDA Performance Comparison
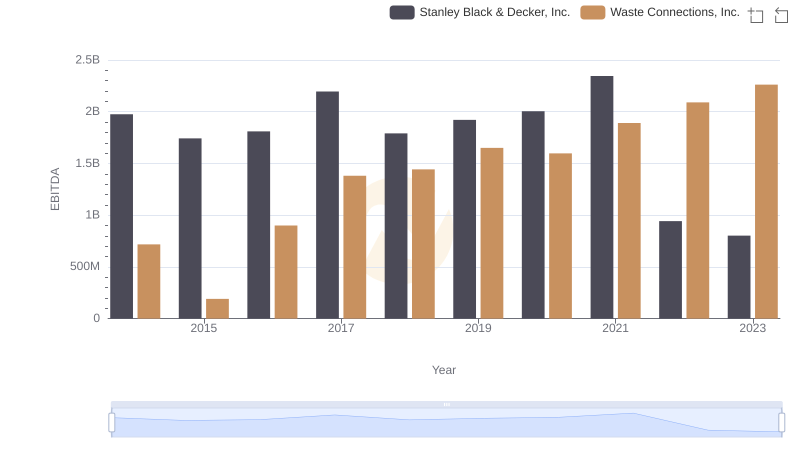
A Professional Review of EBITDA: Waste Connections, Inc. Compared to Stanley Black & Decker, Inc.
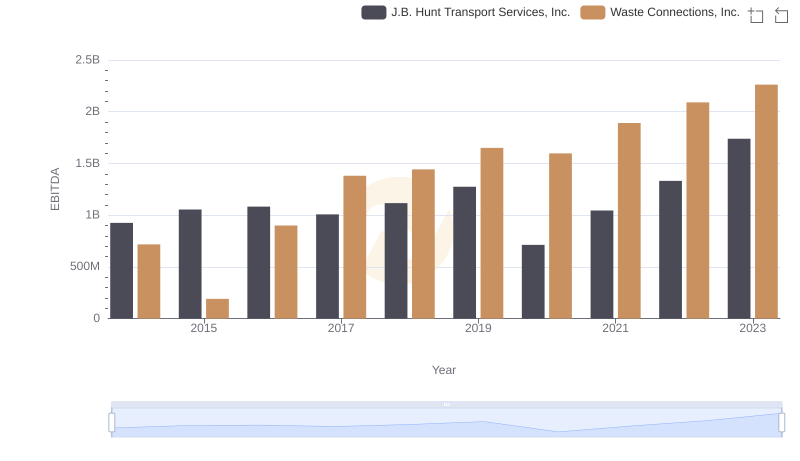
Waste Connections, Inc. and J.B. Hunt Transport Services, Inc.: A Detailed Examination of EBITDA Performance
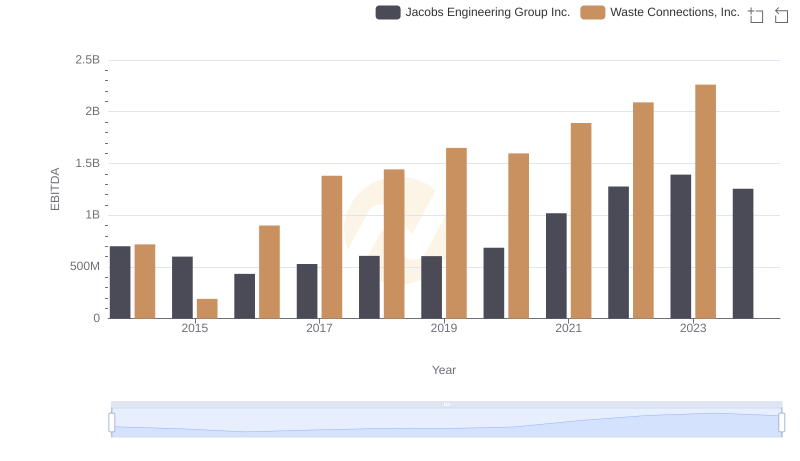
EBITDA Performance Review: Waste Connections, Inc. vs Jacobs Engineering Group Inc.