| __timestamp | J.B. Hunt Transport Services, Inc. | Waste Connections, Inc. |
|---|---|---|
| Wednesday, January 1, 2014 | 6165441000 | 2079166000 |
| Thursday, January 1, 2015 | 6187646000 | 2117287000 |
| Friday, January 1, 2016 | 6555459000 | 3375863000 |
| Sunday, January 1, 2017 | 7189568000 | 4630488000 |
| Monday, January 1, 2018 | 8614874000 | 4922941000 |
| Tuesday, January 1, 2019 | 9165258000 | 5388679000 |
| Wednesday, January 1, 2020 | 9636573000 | 5445990000 |
| Friday, January 1, 2021 | 12168302000 | 6151361000 |
| Saturday, January 1, 2022 | 14813999000 | 7211859000 |
| Sunday, January 1, 2023 | 12829665000 | 8021951000 |
| Monday, January 1, 2024 | 8919591000 |
Unleashing insights
In the competitive landscape of logistics and waste management, J.B. Hunt Transport Services, Inc. and Waste Connections, Inc. have been pivotal players. Over the past decade, J.B. Hunt has consistently outperformed Waste Connections in terms of revenue. Starting in 2014, J.B. Hunt's revenue was nearly three times that of Waste Connections. By 2023, J.B. Hunt's revenue grew by approximately 108%, while Waste Connections saw a remarkable 286% increase, closing the gap significantly.
This data underscores the dynamic shifts in the industry, with both companies showcasing robust growth trajectories.
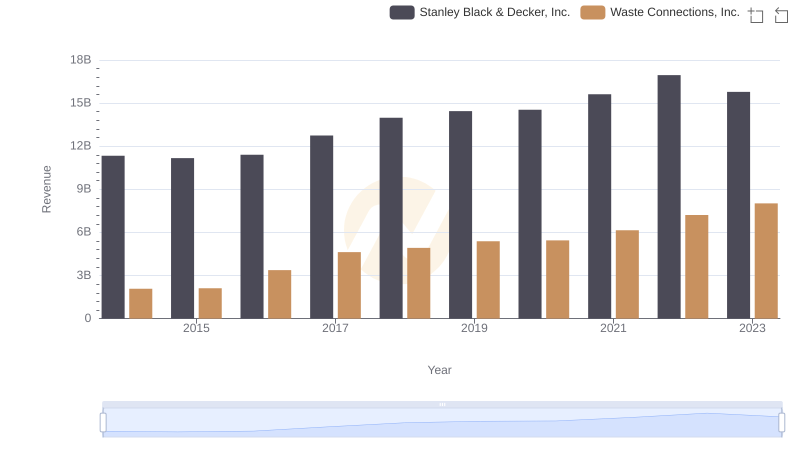
Comparing Revenue Performance: Waste Connections, Inc. or Stanley Black & Decker, Inc.?
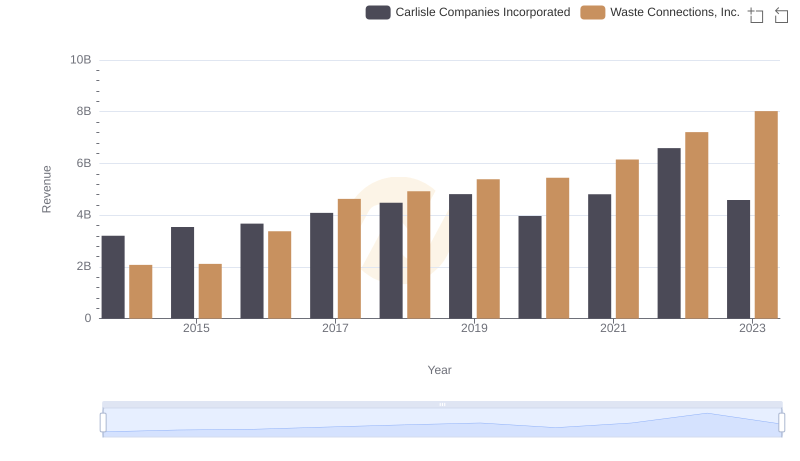
Revenue Showdown: Waste Connections, Inc. vs Carlisle Companies Incorporated
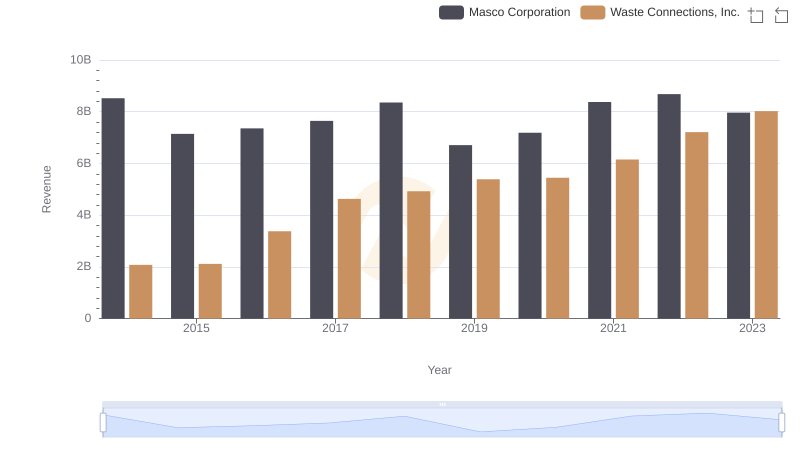
Comparing Revenue Performance: Waste Connections, Inc. or Masco Corporation?
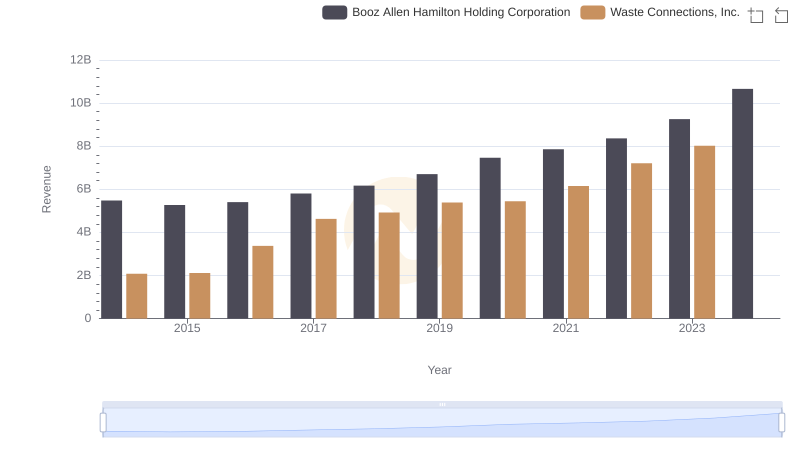
Annual Revenue Comparison: Waste Connections, Inc. vs Booz Allen Hamilton Holding Corporation
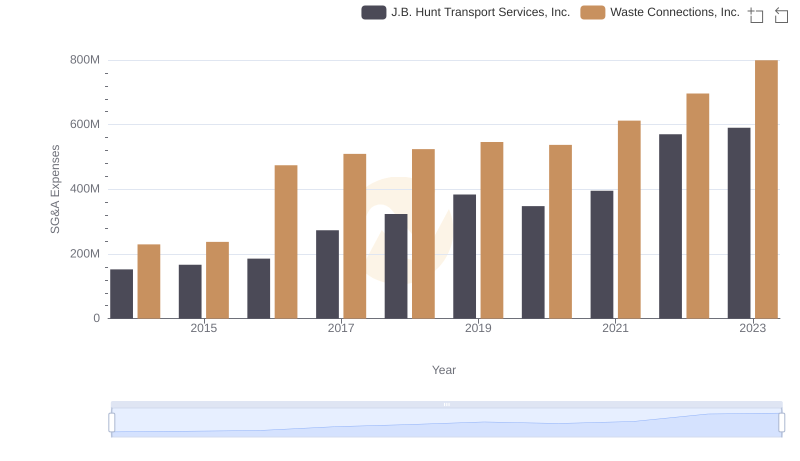
Cost Management Insights: SG&A Expenses for Waste Connections, Inc. and J.B. Hunt Transport Services, Inc.
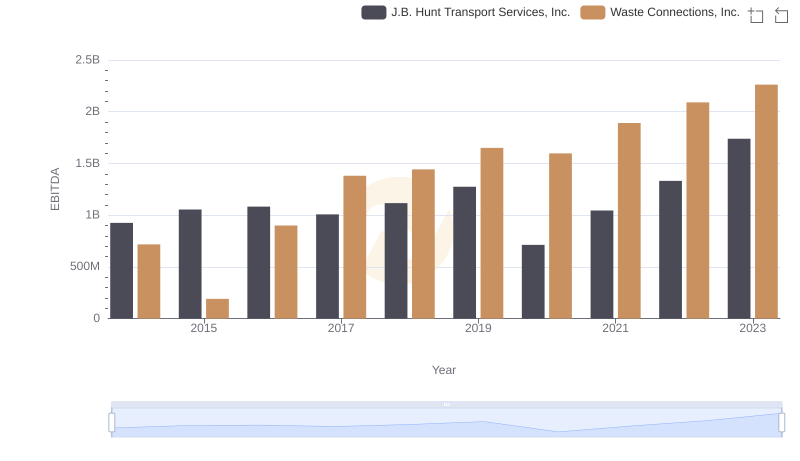
Waste Connections, Inc. and J.B. Hunt Transport Services, Inc.: A Detailed Examination of EBITDA Performance