| __timestamp | Dover Corporation | Waste Connections, Inc. |
|---|---|---|
| Wednesday, January 1, 2014 | 1758765000 | 229474000 |
| Thursday, January 1, 2015 | 1647382000 | 237484000 |
| Friday, January 1, 2016 | 1757523000 | 474263000 |
| Sunday, January 1, 2017 | 1975932000 | 509638000 |
| Monday, January 1, 2018 | 1716444000 | 524388000 |
| Tuesday, January 1, 2019 | 1599098000 | 546278000 |
| Wednesday, January 1, 2020 | 1541032000 | 537632000 |
| Friday, January 1, 2021 | 1688278000 | 612337000 |
| Saturday, January 1, 2022 | 1684226000 | 696467000 |
| Sunday, January 1, 2023 | 1718290000 | 799119000 |
| Monday, January 1, 2024 | 1752266000 | 883445000 |
In pursuit of knowledge
In the world of corporate finance, Selling, General, and Administrative (SG&A) expenses are a critical measure of a company's operational efficiency. Over the past decade, Waste Connections, Inc. and Dover Corporation have showcased contrasting trends in their SG&A expenses.
From 2014 to 2023, Waste Connections, Inc. has seen a remarkable increase in SG&A expenses, growing by approximately 248%. This upward trajectory reflects the company's expansion and investment in administrative capabilities. By 2023, their SG&A expenses reached nearly $800 million, a testament to their strategic growth initiatives.
Conversely, Dover Corporation's SG&A expenses have remained relatively stable, with a slight decrease of about 2% over the same period. This stability suggests a focus on maintaining operational efficiency while managing costs effectively.
These trends offer valuable insights into the strategic priorities and operational efficiencies of these two industry giants.
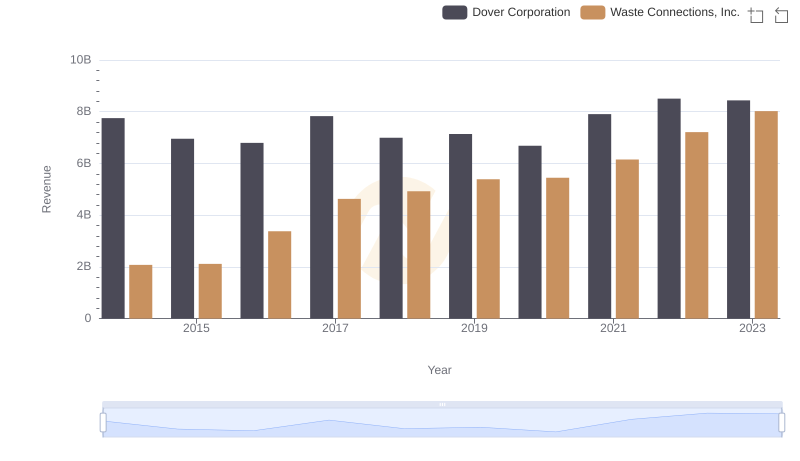
Revenue Showdown: Waste Connections, Inc. vs Dover Corporation
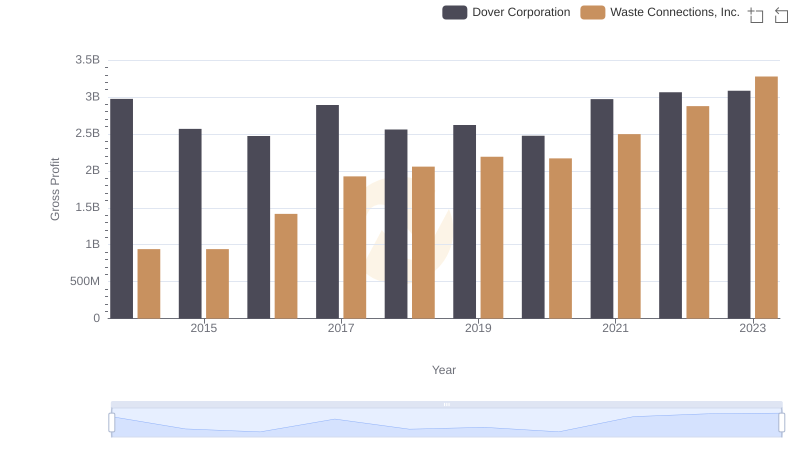
Waste Connections, Inc. and Dover Corporation: A Detailed Gross Profit Analysis
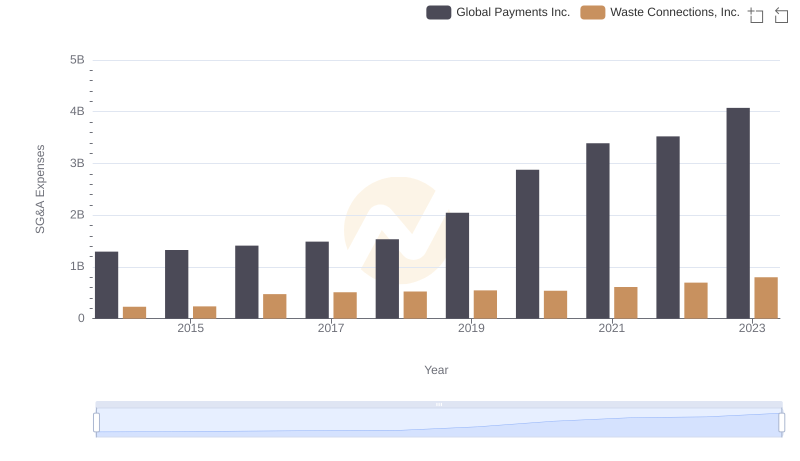
Waste Connections, Inc. and Global Payments Inc.: SG&A Spending Patterns Compared
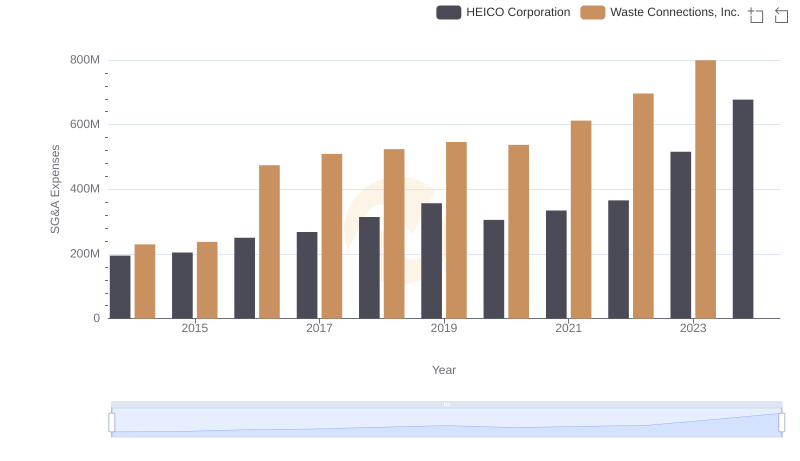
Operational Costs Compared: SG&A Analysis of Waste Connections, Inc. and HEICO Corporation
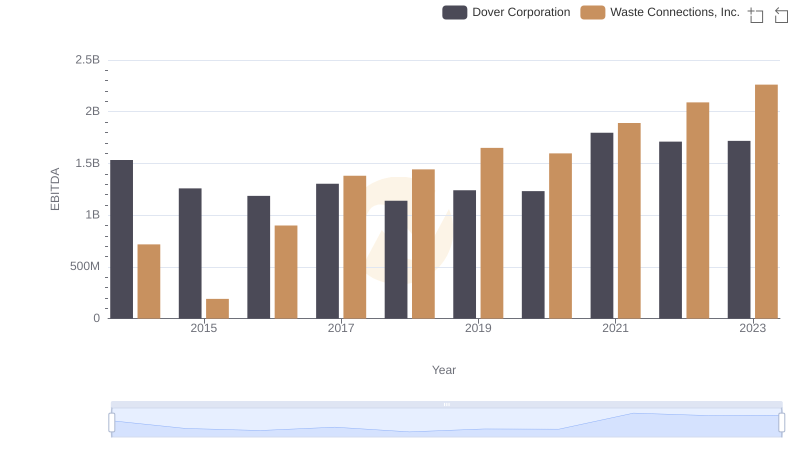
EBITDA Analysis: Evaluating Waste Connections, Inc. Against Dover Corporation