| __timestamp | Equifax Inc. | Waste Connections, Inc. |
|---|---|---|
| Wednesday, January 1, 2014 | 751700000 | 229474000 |
| Thursday, January 1, 2015 | 884300000 | 237484000 |
| Friday, January 1, 2016 | 948200000 | 474263000 |
| Sunday, January 1, 2017 | 1039100000 | 509638000 |
| Monday, January 1, 2018 | 1213300000 | 524388000 |
| Tuesday, January 1, 2019 | 1990200000 | 546278000 |
| Wednesday, January 1, 2020 | 1322500000 | 537632000 |
| Friday, January 1, 2021 | 1324600000 | 612337000 |
| Saturday, January 1, 2022 | 1328900000 | 696467000 |
| Sunday, January 1, 2023 | 1385700000 | 799119000 |
| Monday, January 1, 2024 | 1450500000 | 883445000 |
Unleashing the power of data
In the world of corporate finance, Selling, General, and Administrative (SG&A) expenses are a critical measure of a company's operational efficiency. Over the past decade, Equifax Inc. and Waste Connections, Inc. have demonstrated contrasting SG&A spending patterns.
From 2014 to 2023, Equifax's SG&A expenses surged by approximately 84%, peaking in 2019. This reflects a strategic investment in administrative capabilities, possibly driven by the need to enhance data security and customer trust post-2017. In contrast, Waste Connections, Inc. exhibited a more consistent growth trajectory, with SG&A expenses increasing by around 248% over the same period. This steady rise aligns with the company's expansion and acquisition strategy, underscoring its commitment to operational excellence.
These trends highlight the diverse strategies companies employ to manage operational costs, offering valuable insights for investors and industry analysts alike.
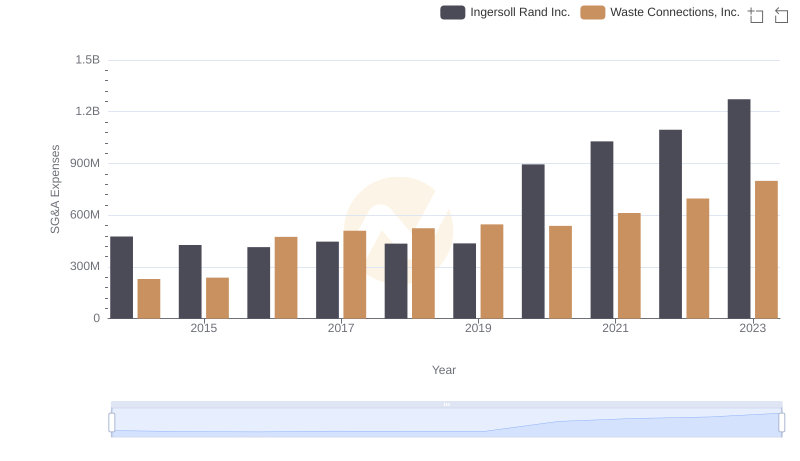
Who Optimizes SG&A Costs Better? Waste Connections, Inc. or Ingersoll Rand Inc.
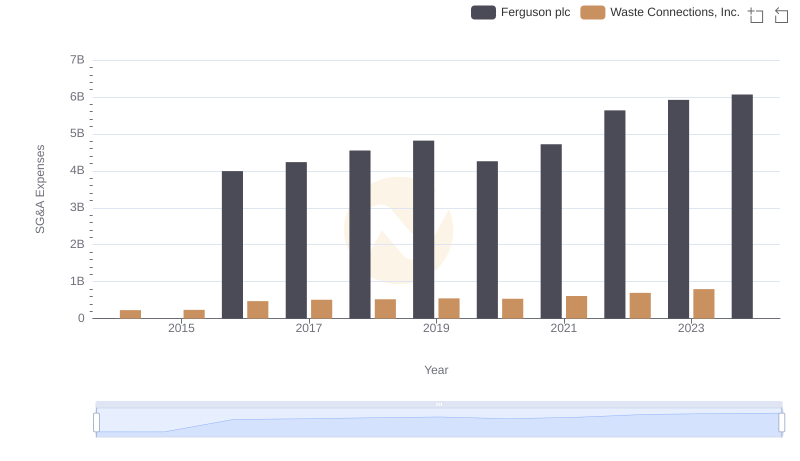
Waste Connections, Inc. or Ferguson plc: Who Manages SG&A Costs Better?
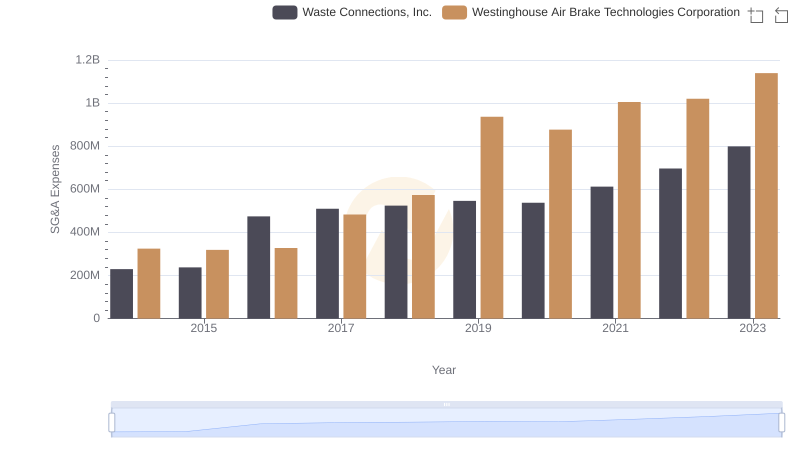
Cost Management Insights: SG&A Expenses for Waste Connections, Inc. and Westinghouse Air Brake Technologies Corporation

Cost Management Insights: SG&A Expenses for Waste Connections, Inc. and Rockwell Automation, Inc.
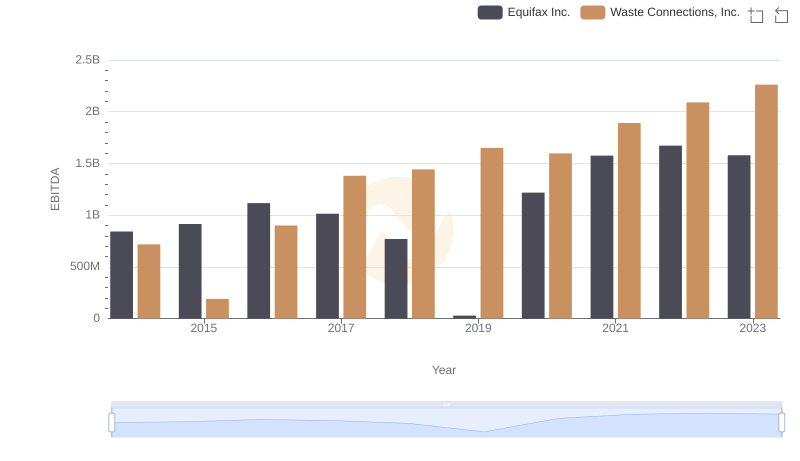
Professional EBITDA Benchmarking: Waste Connections, Inc. vs Equifax Inc.
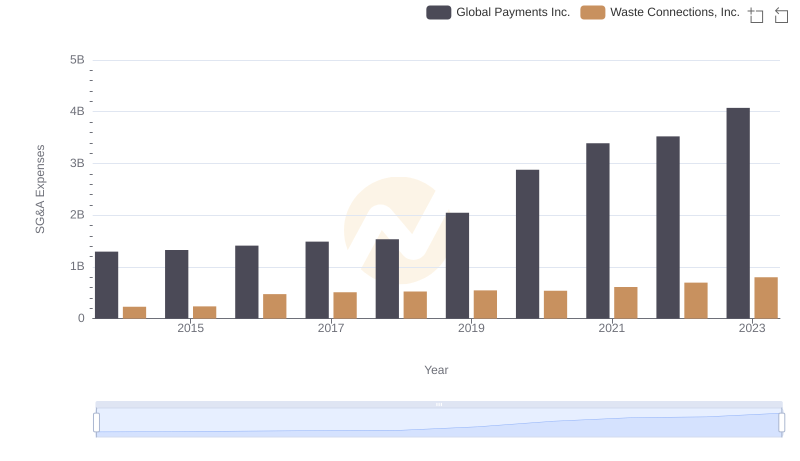
Waste Connections, Inc. and Global Payments Inc.: SG&A Spending Patterns Compared