| __timestamp | American Airlines Group Inc. | United Rentals, Inc. |
|---|---|---|
| Wednesday, January 1, 2014 | 1544000000 | 758000000 |
| Thursday, January 1, 2015 | 1394000000 | 714000000 |
| Friday, January 1, 2016 | 1323000000 | 719000000 |
| Sunday, January 1, 2017 | 1477000000 | 903000000 |
| Monday, January 1, 2018 | 1520000000 | 1038000000 |
| Tuesday, January 1, 2019 | 1602000000 | 1092000000 |
| Wednesday, January 1, 2020 | 513000000 | 979000000 |
| Friday, January 1, 2021 | 1098000000 | 1199000000 |
| Saturday, January 1, 2022 | 1815000000 | 1400000000 |
| Sunday, January 1, 2023 | 1799000000 | 1527000000 |
| Monday, January 1, 2024 | 1645000000 |
Igniting the spark of knowledge
In the world of corporate finance, Selling, General, and Administrative (SG&A) expenses are a critical measure of operational efficiency. This analysis compares the SG&A expenses of two industry giants: American Airlines Group Inc. and United Rentals, Inc., from 2014 to 2023.
American Airlines, a leader in the aviation sector, saw its SG&A expenses fluctuate, peaking in 2022 with a 29% increase from 2016. The pandemic year of 2020 marked a significant dip, with expenses dropping by 68% compared to 2019. Meanwhile, United Rentals, a key player in equipment rental, demonstrated a steady upward trend, with a 115% increase in SG&A expenses from 2014 to 2023.
This comparison highlights the resilience and adaptability of these companies in navigating economic challenges and industry-specific demands.
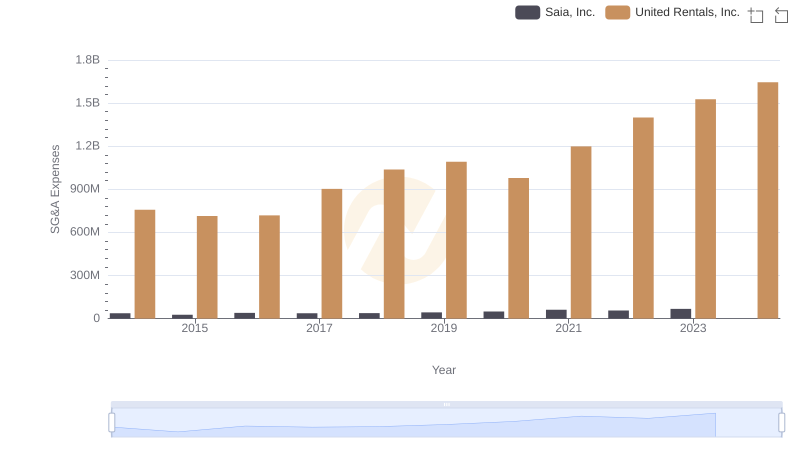
Breaking Down SG&A Expenses: United Rentals, Inc. vs Saia, Inc.
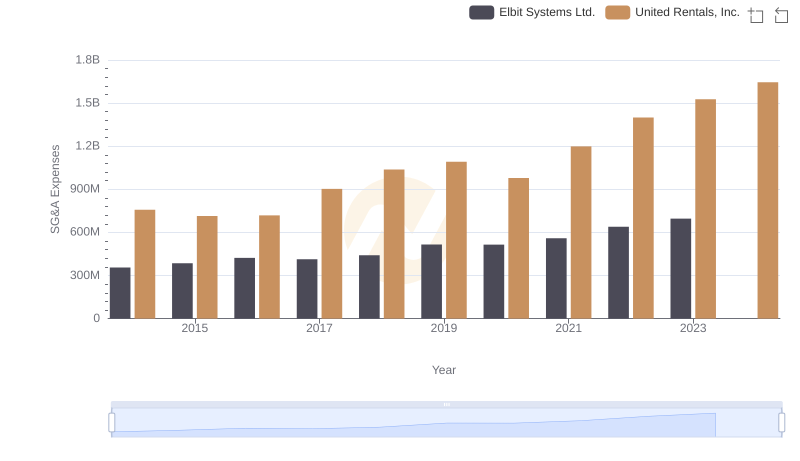
Operational Costs Compared: SG&A Analysis of United Rentals, Inc. and Elbit Systems Ltd.
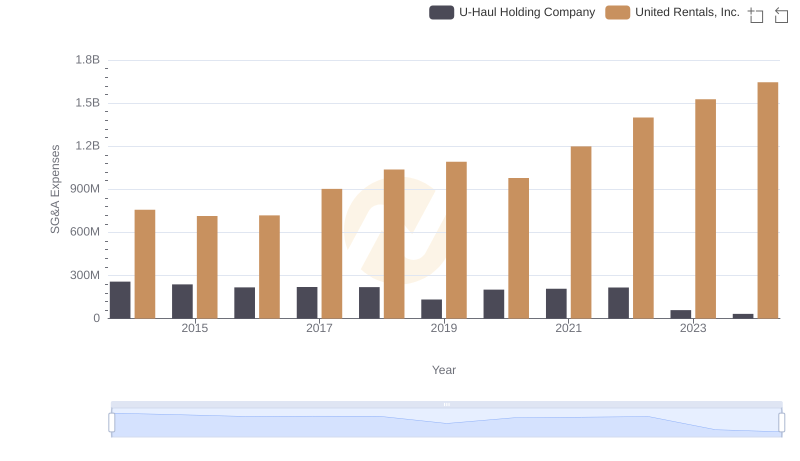
Comparing SG&A Expenses: United Rentals, Inc. vs U-Haul Holding Company Trends and Insights
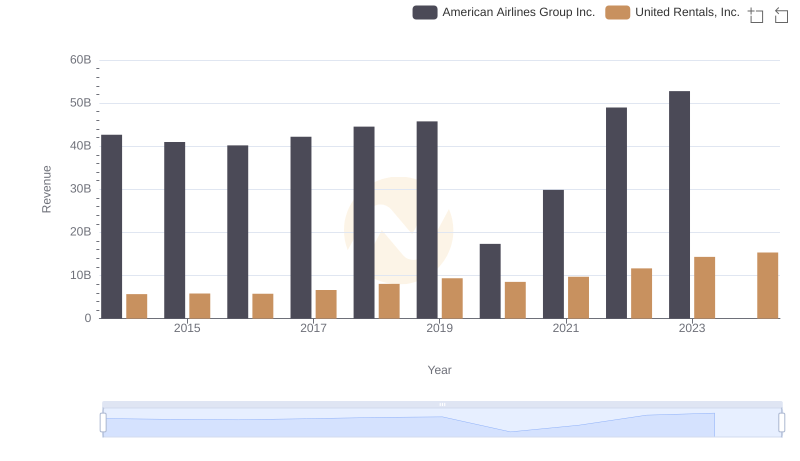
Breaking Down Revenue Trends: United Rentals, Inc. vs American Airlines Group Inc.
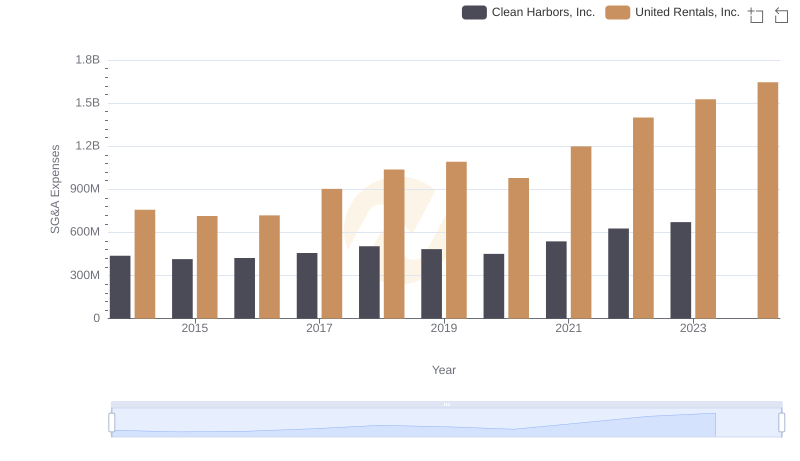
Operational Costs Compared: SG&A Analysis of United Rentals, Inc. and Clean Harbors, Inc.
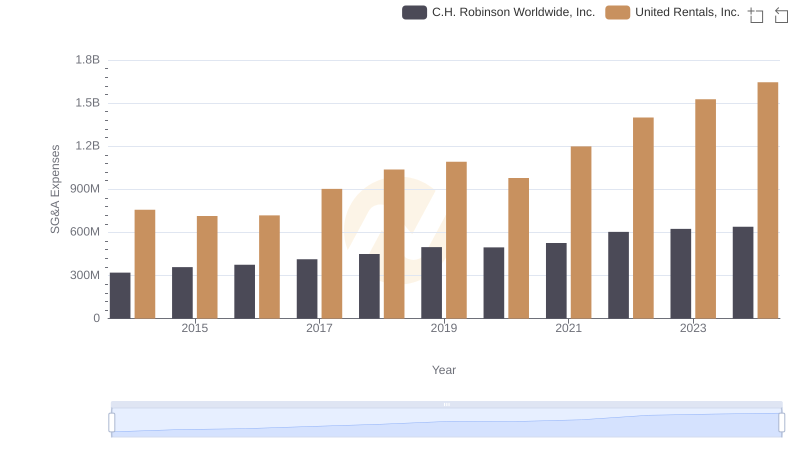
United Rentals, Inc. and C.H. Robinson Worldwide, Inc.: SG&A Spending Patterns Compared

Comparing SG&A Expenses: United Rentals, Inc. vs Curtiss-Wright Corporation Trends and Insights
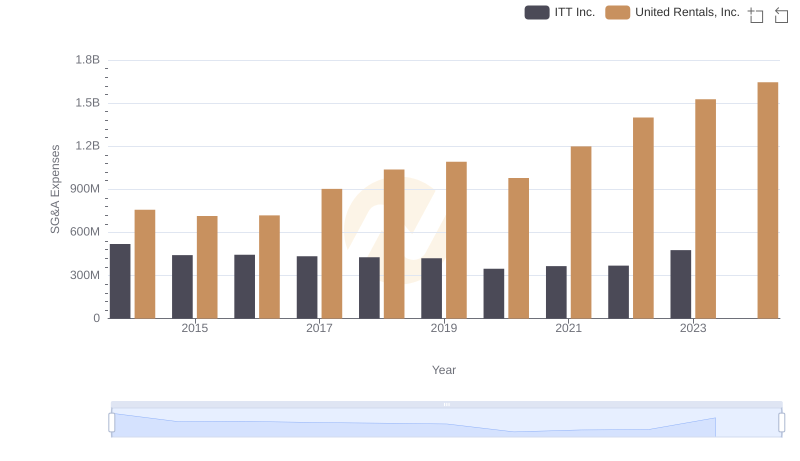
SG&A Efficiency Analysis: Comparing United Rentals, Inc. and ITT Inc.
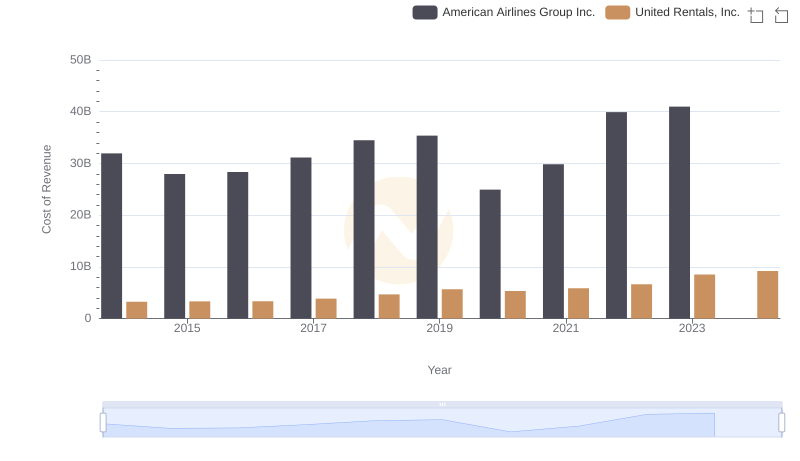
Cost of Revenue Trends: United Rentals, Inc. vs American Airlines Group Inc.
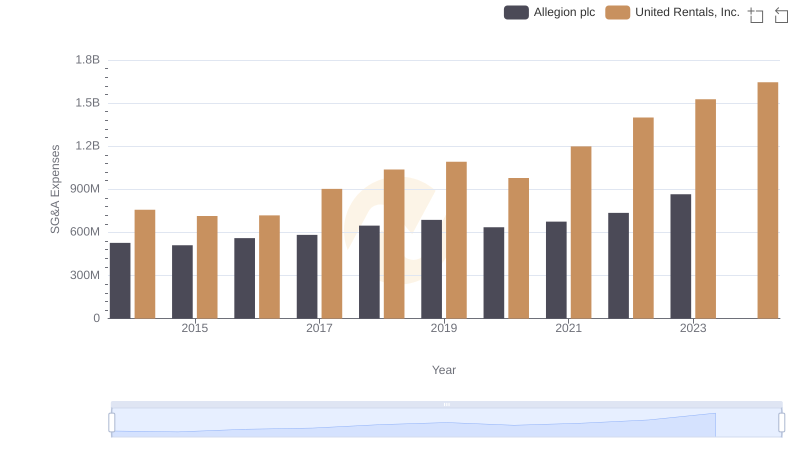
United Rentals, Inc. vs Allegion plc: SG&A Expense Trends
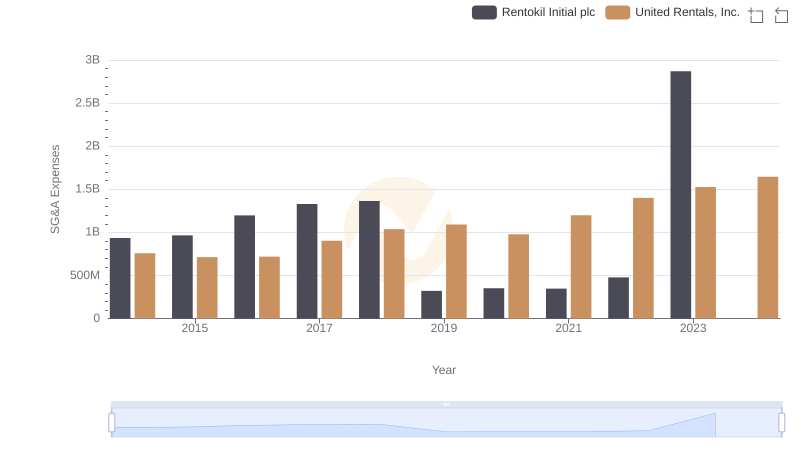
United Rentals, Inc. or Rentokil Initial plc: Who Manages SG&A Costs Better?