| __timestamp | Deere & Company | Union Pacific Corporation |
|---|---|---|
| Wednesday, January 1, 2014 | 10466900000 | 9677000000 |
| Thursday, January 1, 2015 | 8013100000 | 8976000000 |
| Friday, January 1, 2016 | 7649600000 | 8269000000 |
| Sunday, January 1, 2017 | 8683100000 | 9009000000 |
| Monday, January 1, 2018 | 10886100000 | 9539000000 |
| Tuesday, January 1, 2019 | 11587000000 | 9614000000 |
| Wednesday, January 1, 2020 | 11045000000 | 9179000000 |
| Friday, January 1, 2021 | 13917000000 | 10514000000 |
| Saturday, January 1, 2022 | 17239000000 | 11205000000 |
| Sunday, January 1, 2023 | 21117000000 | 10529000000 |
| Monday, January 1, 2024 | 13984000000 | 11039000000 |
Infusing magic into the data realm
In the world of industrial titans, Union Pacific Corporation and Deere & Company have long been stalwarts of American industry. Over the past decade, these two companies have showcased contrasting trajectories in their gross profit performance. From 2014 to 2023, Deere & Company has seen a remarkable growth of approximately 102%, with its gross profit peaking in 2023. This surge highlights Deere's resilience and adaptability in a rapidly changing market. In contrast, Union Pacific's growth has been more modest, with a peak in 2022, reflecting a steady yet less dynamic performance. Notably, the data for 2024 is incomplete, leaving room for speculation on future trends. As these companies continue to navigate economic challenges, their financial performances offer valuable insights into the broader industrial landscape.
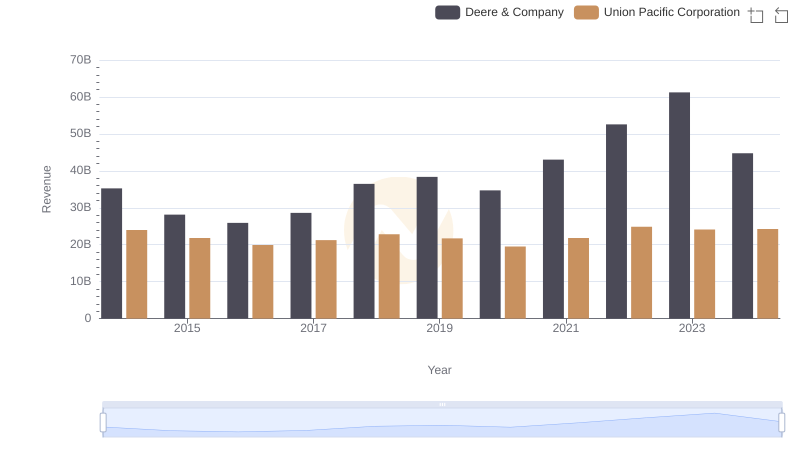
Union Pacific Corporation vs Deere & Company: Examining Key Revenue Metrics
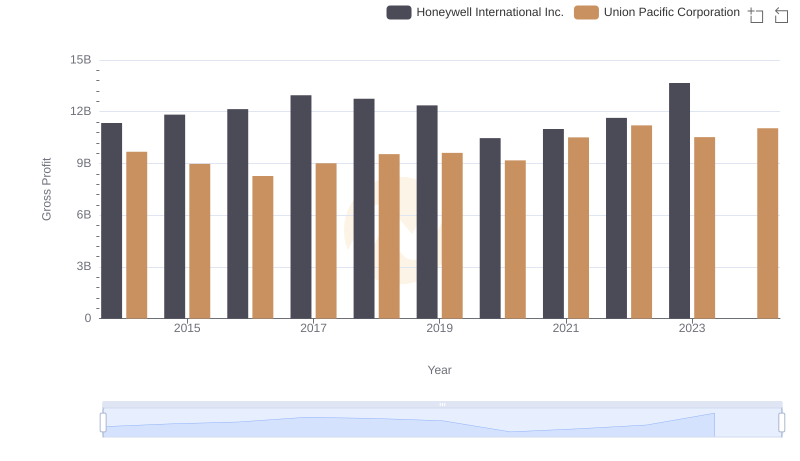
Gross Profit Comparison: Union Pacific Corporation and Honeywell International Inc. Trends

Gross Profit Comparison: Union Pacific Corporation and United Parcel Service, Inc. Trends

Who Generates Higher Gross Profit? Union Pacific Corporation or Waste Management, Inc.

EBITDA Performance Review: Union Pacific Corporation vs Deere & Company
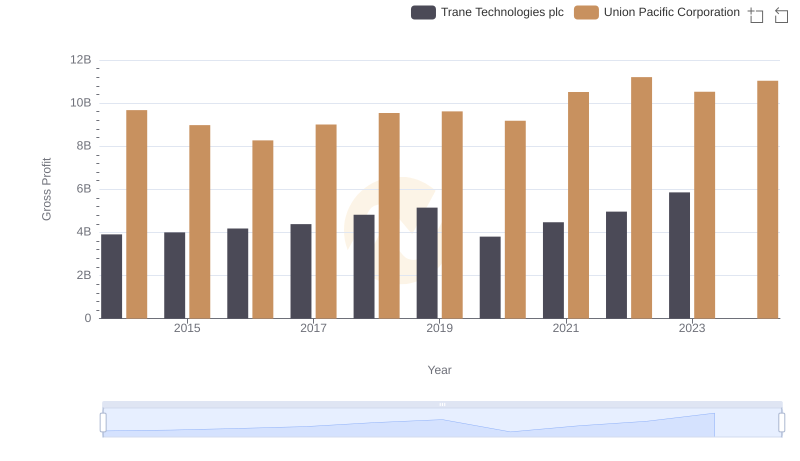
Union Pacific Corporation vs Trane Technologies plc: A Gross Profit Performance Breakdown

Union Pacific Corporation vs Cintas Corporation: A Gross Profit Performance Breakdown