| __timestamp | Illinois Tool Works Inc. | Union Pacific Corporation |
|---|---|---|
| Wednesday, January 1, 2014 | 5811000000 | 9677000000 |
| Thursday, January 1, 2015 | 5517000000 | 8976000000 |
| Friday, January 1, 2016 | 5703000000 | 8269000000 |
| Sunday, January 1, 2017 | 6005000000 | 9009000000 |
| Monday, January 1, 2018 | 6164000000 | 9539000000 |
| Tuesday, January 1, 2019 | 5922000000 | 9614000000 |
| Wednesday, January 1, 2020 | 5199000000 | 9179000000 |
| Friday, January 1, 2021 | 5966000000 | 10514000000 |
| Saturday, January 1, 2022 | 6503000000 | 11205000000 |
| Sunday, January 1, 2023 | 6791000000 | 10529000000 |
| Monday, January 1, 2024 | 7040000000 | 11039000000 |
Igniting the spark of knowledge
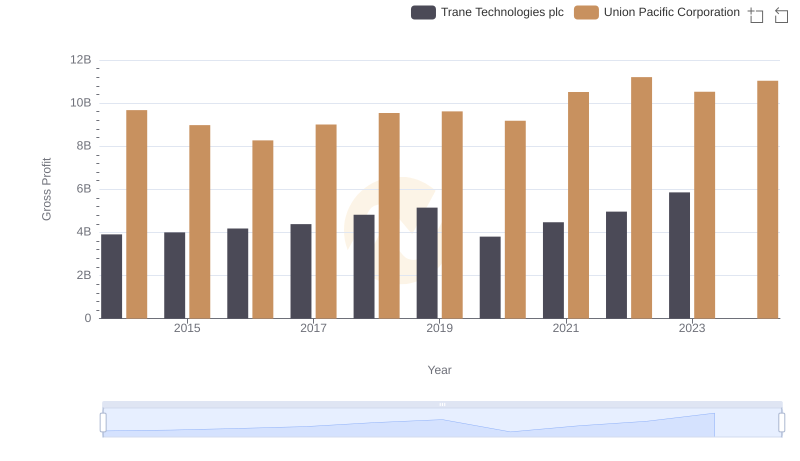
In the world of industrial titans, Union Pacific Corporation and Illinois Tool Works Inc. have long been stalwarts of American industry. Over the past decade, these companies have showcased their prowess in generating substantial gross profits. From 2014 to 2023, Union Pacific consistently outperformed Illinois Tool Works, with an average gross profit nearly 64% higher.
Union Pacific's gross profit peaked in 2022, reaching a remarkable 11.2 billion, while Illinois Tool Works saw its highest in 2023 at 6.8 billion. Notably, Union Pacific's profits surged by approximately 21% from 2016 to 2022, reflecting its robust growth strategy. Meanwhile, Illinois Tool Works experienced a steady climb, with a notable 30% increase from 2020 to 2023.
The data for Illinois Tool Works in 2024 is currently unavailable, leaving room for speculation on its future trajectory. As these industrial giants continue to evolve, their financial performances remain a testament to their enduring legacies.