| __timestamp | Howmet Aerospace Inc. | Union Pacific Corporation |
|---|---|---|
| Wednesday, January 1, 2014 | 2193000000 | 9677000000 |
| Thursday, January 1, 2015 | 2309000000 | 8976000000 |
| Friday, January 1, 2016 | 2588000000 | 8269000000 |
| Sunday, January 1, 2017 | 2603000000 | 9009000000 |
| Monday, January 1, 2018 | 2617000000 | 9539000000 |
| Tuesday, January 1, 2019 | 2965000000 | 9614000000 |
| Wednesday, January 1, 2020 | 1381000000 | 9179000000 |
| Friday, January 1, 2021 | 1376000000 | 10514000000 |
| Saturday, January 1, 2022 | 1560000000 | 11205000000 |
| Sunday, January 1, 2023 | 1867000000 | 10529000000 |
| Monday, January 1, 2024 | 2311000000 | 11039000000 |
Infusing magic into the data realm
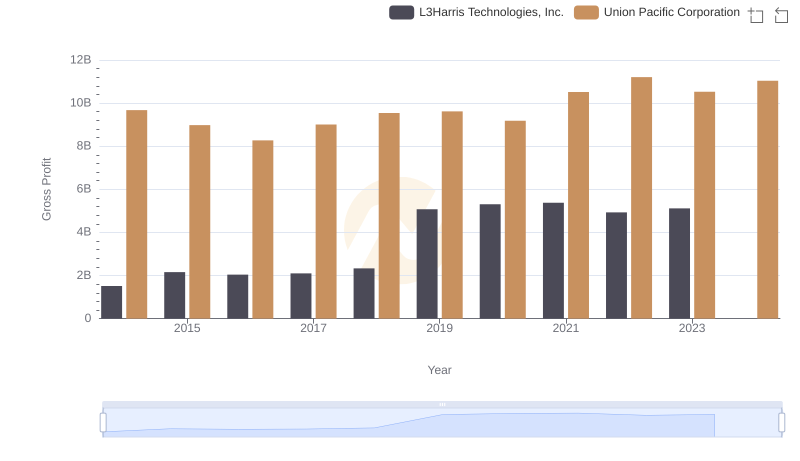
In the ever-evolving landscape of American industry, Union Pacific Corporation and Howmet Aerospace Inc. stand as titans in their respective fields. From 2014 to 2023, Union Pacific consistently outperformed Howmet Aerospace in terms of gross profit, showcasing a robust growth trajectory. Union Pacific's gross profit peaked in 2022, reaching approximately 11.2 billion, marking a 16% increase from 2014. In contrast, Howmet Aerospace experienced fluctuations, with a notable dip in 2020, reflecting the broader economic challenges of that year. However, by 2023, Howmet showed signs of recovery, with a gross profit of around 1.9 billion, a 36% increase from its 2020 low. This comparison highlights the resilience and adaptability of these industrial giants, each navigating their unique challenges and opportunities in the market.
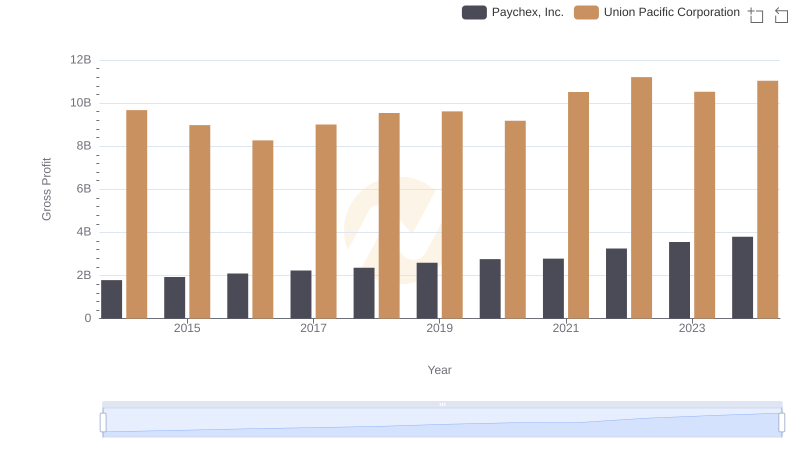
Gross Profit Analysis: Comparing Union Pacific Corporation and Paychex, Inc.
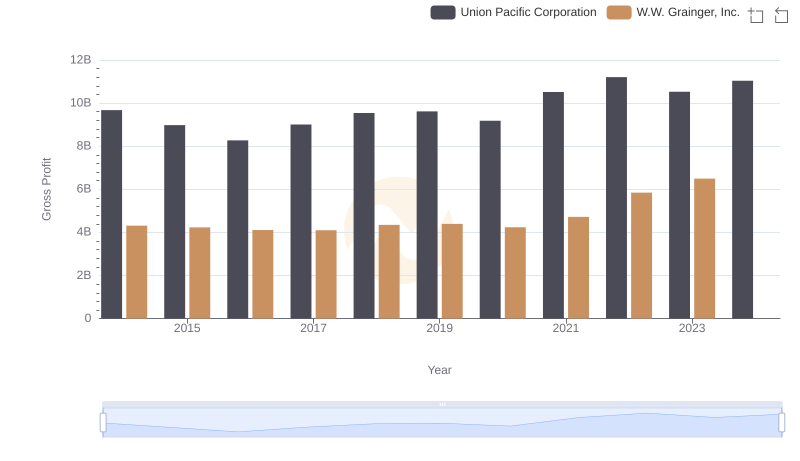
Union Pacific Corporation and W.W. Grainger, Inc.: A Detailed Gross Profit Analysis
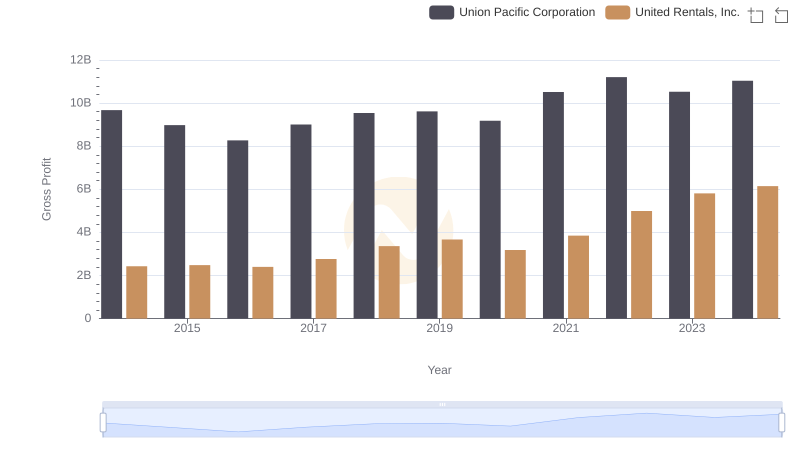
Union Pacific Corporation and United Rentals, Inc.: A Detailed Gross Profit Analysis
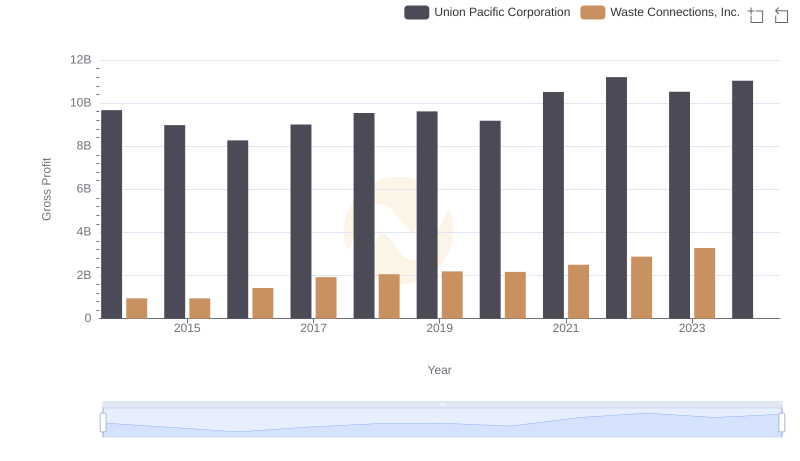
Gross Profit Analysis: Comparing Union Pacific Corporation and Waste Connections, Inc.
Key Insights on Gross Profit: Union Pacific Corporation vs L3Harris Technologies, Inc.