| __timestamp | L3Harris Technologies, Inc. | Union Pacific Corporation |
|---|---|---|
| Wednesday, January 1, 2014 | 1515000000 | 9677000000 |
| Thursday, January 1, 2015 | 2160000000 | 8976000000 |
| Friday, January 1, 2016 | 2043000000 | 8269000000 |
| Sunday, January 1, 2017 | 2102000000 | 9009000000 |
| Monday, January 1, 2018 | 2334000000 | 9539000000 |
| Tuesday, January 1, 2019 | 5074000000 | 9614000000 |
| Wednesday, January 1, 2020 | 5308000000 | 9179000000 |
| Friday, January 1, 2021 | 5376000000 | 10514000000 |
| Saturday, January 1, 2022 | 4927000000 | 11205000000 |
| Sunday, January 1, 2023 | 5113000000 | 10529000000 |
| Monday, January 1, 2024 | 5524000000 | 11039000000 |
Infusing magic into the data realm
In the ever-evolving landscape of American industry, Union Pacific Corporation and L3Harris Technologies, Inc. stand as titans in their respective fields. Over the past decade, Union Pacific has consistently demonstrated robust financial health, with its gross profit peaking at approximately $11.2 billion in 2022, marking a 16% increase from 2014. Meanwhile, L3Harris Technologies has shown remarkable growth, with its gross profit more than tripling from 2014 to 2023, reaching around $5.1 billion.
Union Pacific's steady climb reflects its dominance in the transportation sector, while L3Harris's surge underscores its strategic advancements in defense technology. However, the data for 2024 is incomplete for L3Harris, leaving room for speculation on its future trajectory. This comparison not only highlights the financial prowess of these corporations but also offers insights into the broader economic trends shaping their industries.
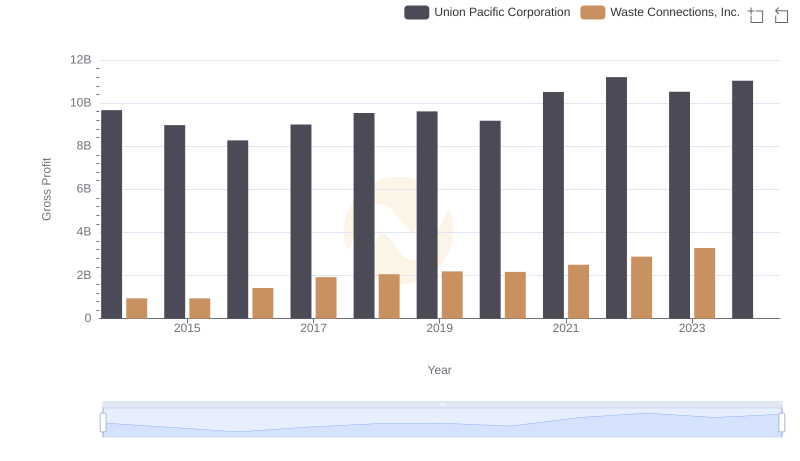
Gross Profit Analysis: Comparing Union Pacific Corporation and Waste Connections, Inc.
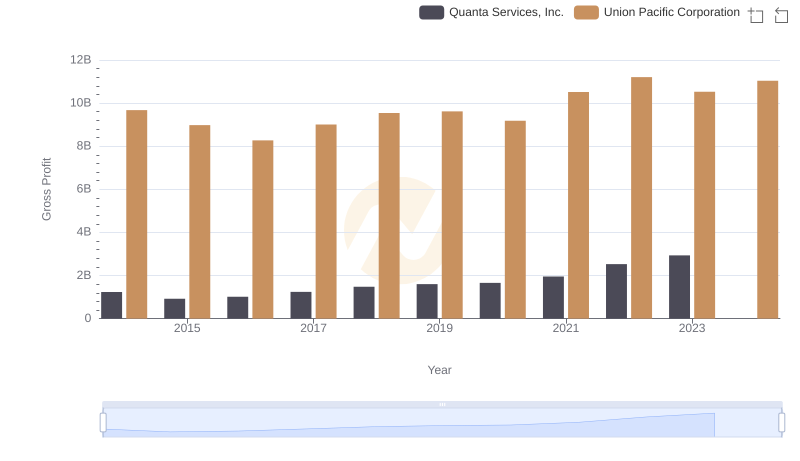
Gross Profit Trends Compared: Union Pacific Corporation vs Quanta Services, Inc.
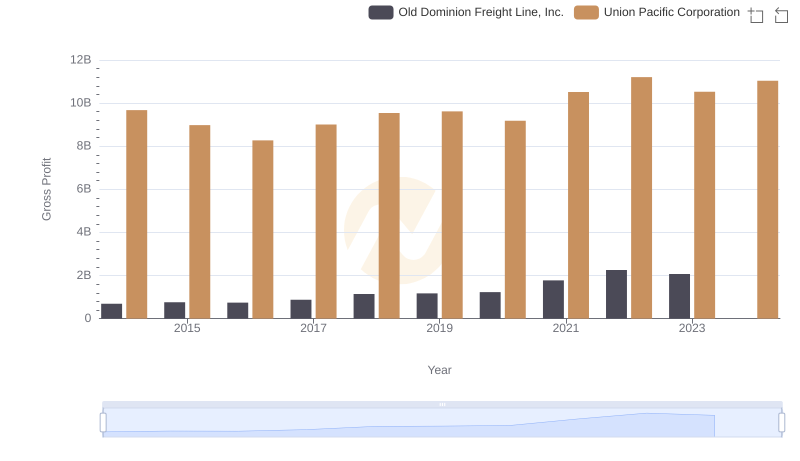
Who Generates Higher Gross Profit? Union Pacific Corporation or Old Dominion Freight Line, Inc.
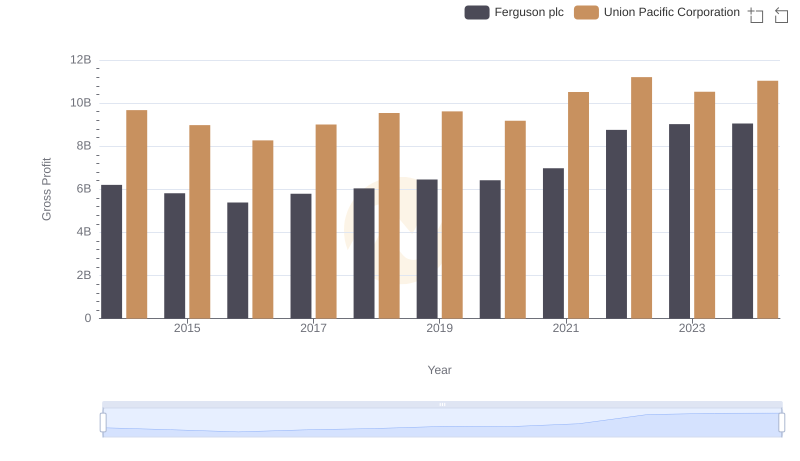
Union Pacific Corporation vs Ferguson plc: A Gross Profit Performance Breakdown