| __timestamp | Union Pacific Corporation | Waste Connections, Inc. |
|---|---|---|
| Wednesday, January 1, 2014 | 9677000000 | 940778000 |
| Thursday, January 1, 2015 | 8976000000 | 939878000 |
| Friday, January 1, 2016 | 8269000000 | 1418151000 |
| Sunday, January 1, 2017 | 9009000000 | 1925713000 |
| Monday, January 1, 2018 | 9539000000 | 2057237000 |
| Tuesday, January 1, 2019 | 9614000000 | 2189922000 |
| Wednesday, January 1, 2020 | 9179000000 | 2169182000 |
| Friday, January 1, 2021 | 10514000000 | 2497287000 |
| Saturday, January 1, 2022 | 11205000000 | 2875847000 |
| Sunday, January 1, 2023 | 10529000000 | 3277438000 |
| Monday, January 1, 2024 | 11039000000 | 3727885000 |
Data in motion
In the ever-evolving landscape of American industry, Union Pacific Corporation and Waste Connections, Inc. stand as titans in their respective fields. Over the past decade, Union Pacific has consistently demonstrated robust financial health, with its gross profit peaking at approximately $11.2 billion in 2022, marking a 16% increase from 2014. Meanwhile, Waste Connections has shown impressive growth, with its gross profit surging by nearly 250% from 2014 to 2023, reaching around $3.3 billion. This remarkable growth trajectory underscores the increasing demand for waste management services in a rapidly urbanizing world. However, data for 2024 is incomplete, highlighting the dynamic nature of financial forecasting. As these companies continue to navigate economic challenges, their financial performance offers valuable insights into the broader economic trends shaping the United States.
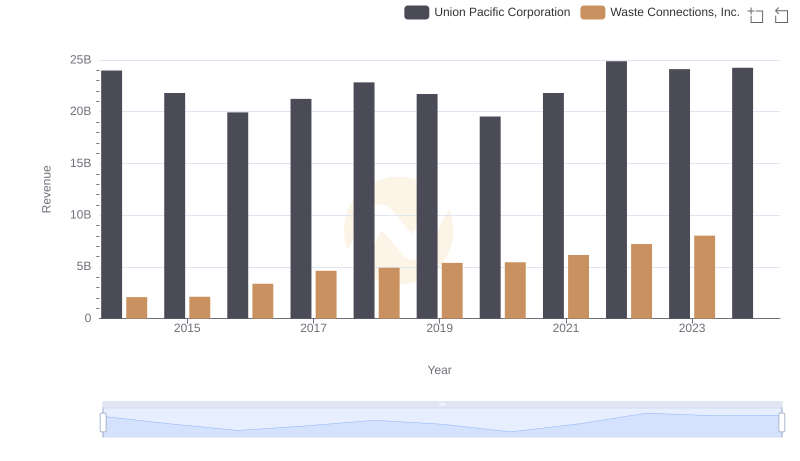
Union Pacific Corporation and Waste Connections, Inc.: A Comprehensive Revenue Analysis
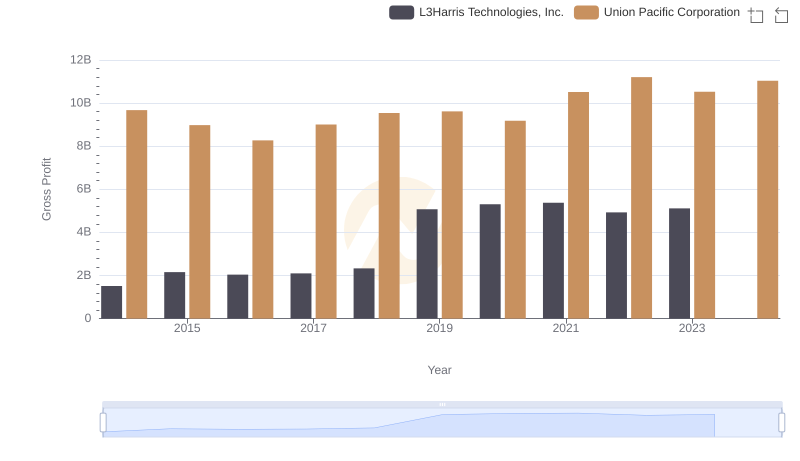
Key Insights on Gross Profit: Union Pacific Corporation vs L3Harris Technologies, Inc.
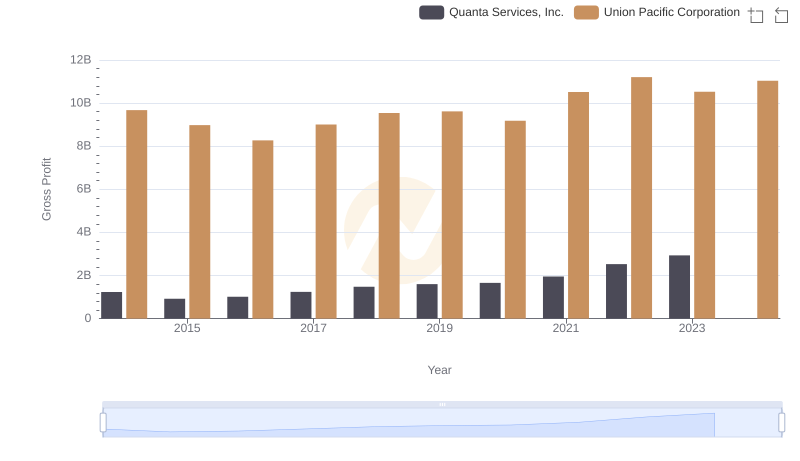
Gross Profit Trends Compared: Union Pacific Corporation vs Quanta Services, Inc.
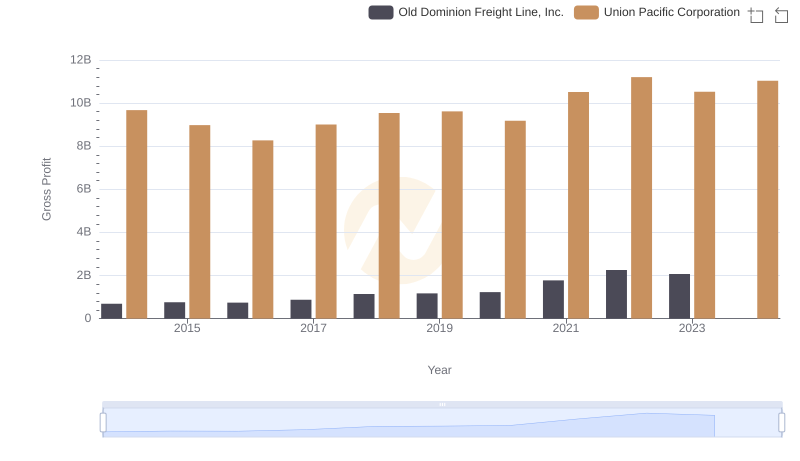
Who Generates Higher Gross Profit? Union Pacific Corporation or Old Dominion Freight Line, Inc.