| __timestamp | Fastenal Company | Trane Technologies plc |
|---|---|---|
| Wednesday, January 1, 2014 | 859298000 | 1757000000 |
| Thursday, January 1, 2015 | 915726000 | 1835000000 |
| Friday, January 1, 2016 | 900285000 | 2311000000 |
| Sunday, January 1, 2017 | 1008200000 | 1982500000 |
| Monday, January 1, 2018 | 1136900000 | 2242400000 |
| Tuesday, January 1, 2019 | 1205900000 | 1931200000 |
| Wednesday, January 1, 2020 | 1304200000 | 1831900000 |
| Friday, January 1, 2021 | 1388200000 | 2319200000 |
| Saturday, January 1, 2022 | 1630900000 | 2715500000 |
| Sunday, January 1, 2023 | 1706000000 | 3149900000 |
| Monday, January 1, 2024 | 1510000000 | 3859600000 |
Cracking the code
In the ever-evolving landscape of industrial giants, Trane Technologies plc and Fastenal Company have emerged as key players. Over the past decade, from 2014 to 2023, these companies have demonstrated remarkable EBITDA growth, a crucial indicator of financial health and operational efficiency.
Fastenal Company, a leader in industrial supplies, has seen its EBITDA grow by approximately 99% from 2014 to 2023. This growth reflects its strategic expansion and operational efficiency. Meanwhile, Trane Technologies, a global innovator in climate solutions, has experienced an impressive 79% increase in EBITDA over the same period, underscoring its commitment to sustainable innovation.
Interestingly, the data for 2024 shows a dip for Fastenal, while Trane Technologies' data is missing, leaving room for speculation about future trends. As these companies continue to adapt to market demands, their financial trajectories will be closely watched by investors and industry analysts alike.

Trane Technologies plc vs Fastenal Company: Annual Revenue Growth Compared
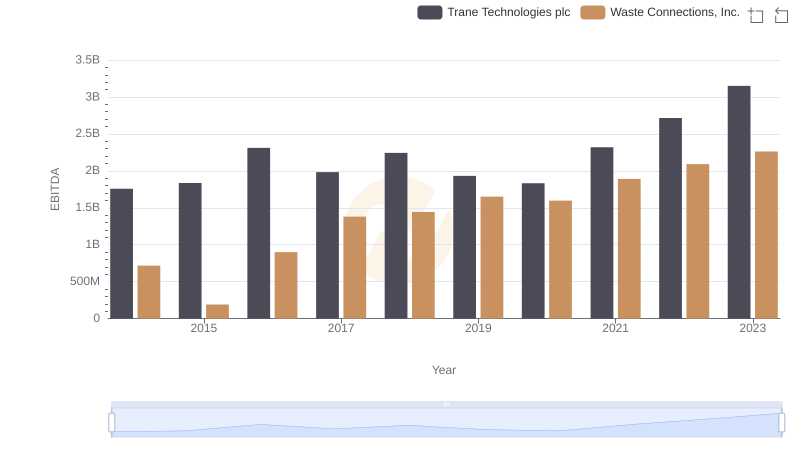
Trane Technologies plc and Waste Connections, Inc.: A Detailed Examination of EBITDA Performance
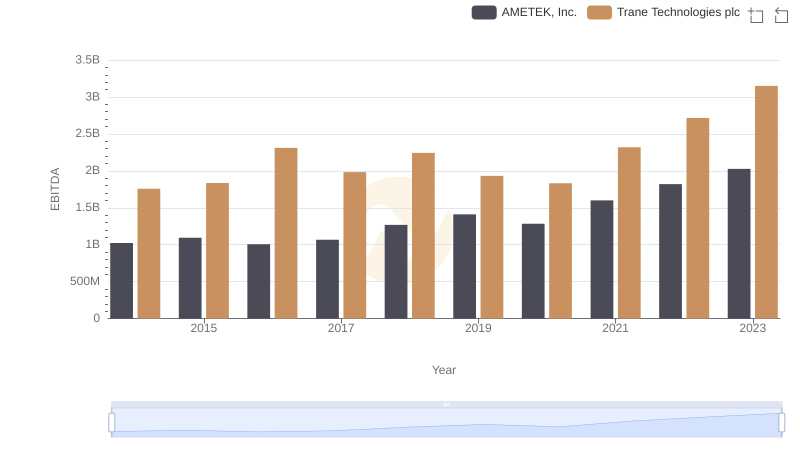
EBITDA Performance Review: Trane Technologies plc vs AMETEK, Inc.
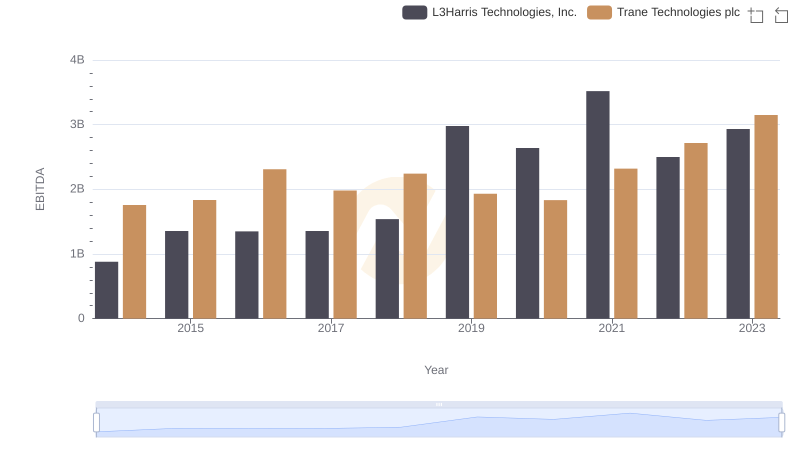
Comparative EBITDA Analysis: Trane Technologies plc vs L3Harris Technologies, Inc.
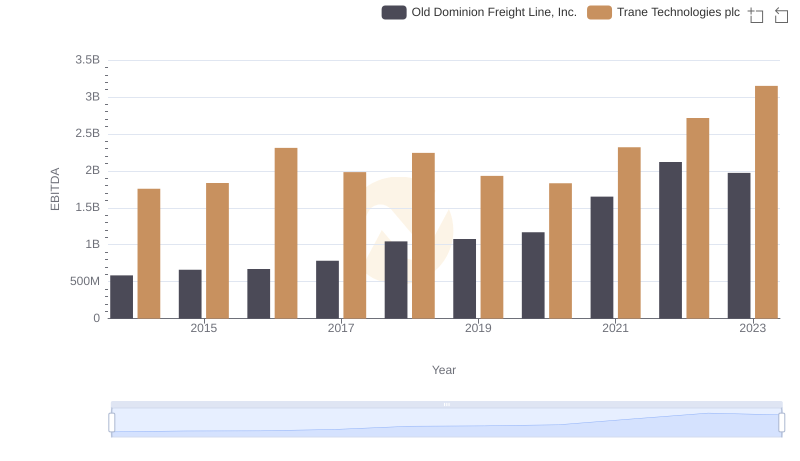
EBITDA Metrics Evaluated: Trane Technologies plc vs Old Dominion Freight Line, Inc.
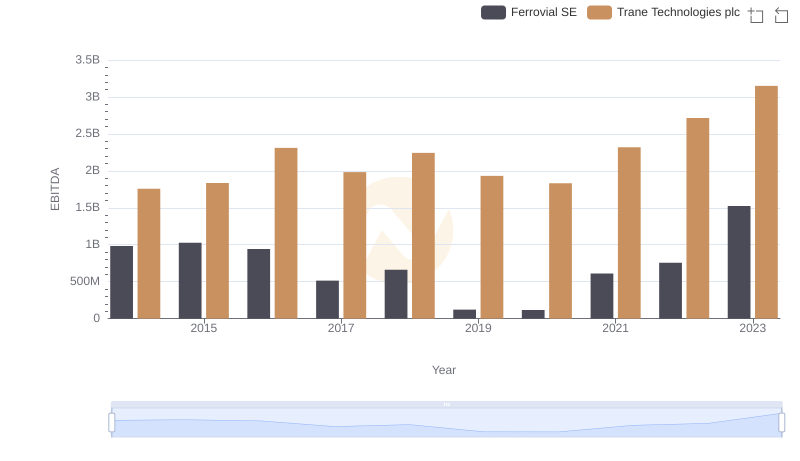
Professional EBITDA Benchmarking: Trane Technologies plc vs Ferrovial SE