| __timestamp | 3M Company | Trane Technologies plc |
|---|---|---|
| Wednesday, January 1, 2014 | 31821000000 | 12891400000 |
| Thursday, January 1, 2015 | 30274000000 | 13300700000 |
| Friday, January 1, 2016 | 30109000000 | 13508900000 |
| Sunday, January 1, 2017 | 31657000000 | 14197600000 |
| Monday, January 1, 2018 | 32765000000 | 15668200000 |
| Tuesday, January 1, 2019 | 32136000000 | 16598900000 |
| Wednesday, January 1, 2020 | 32184000000 | 12454700000 |
| Friday, January 1, 2021 | 35355000000 | 14136400000 |
| Saturday, January 1, 2022 | 34229000000 | 15991700000 |
| Sunday, January 1, 2023 | 32681000000 | 17677600000 |
| Monday, January 1, 2024 | 24575000000 | 19838200000 |
Data in motion
In the ever-evolving landscape of industrial innovation, Trane Technologies and 3M Company stand as titans. Over the past decade, these companies have showcased their prowess in revenue generation, albeit with contrasting trajectories. From 2014 to 2023, 3M's revenue fluctuated, peaking in 2021 with a 12% increase from 2015, before experiencing a decline in 2024. Meanwhile, Trane Technologies demonstrated a steady upward trend, culminating in a remarkable 37% growth from 2014 to 2023.
3M's revenue journey reflects resilience amidst market challenges, with a notable dip in 2024. In contrast, Trane Technologies' consistent growth underscores its strategic market positioning and innovation. The absence of data for Trane in 2024 leaves room for speculation on its future trajectory. As these industrial giants continue to navigate the global market, their revenue trends offer valuable insights into their strategic directions and market adaptability.
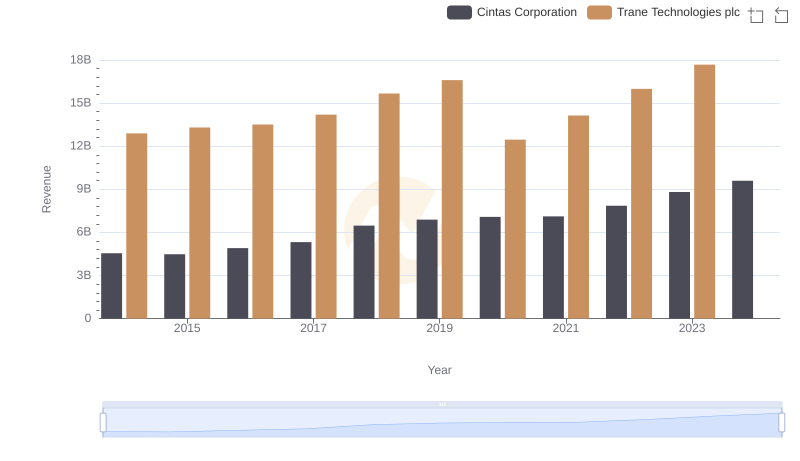
Trane Technologies plc vs Cintas Corporation: Annual Revenue Growth Compared
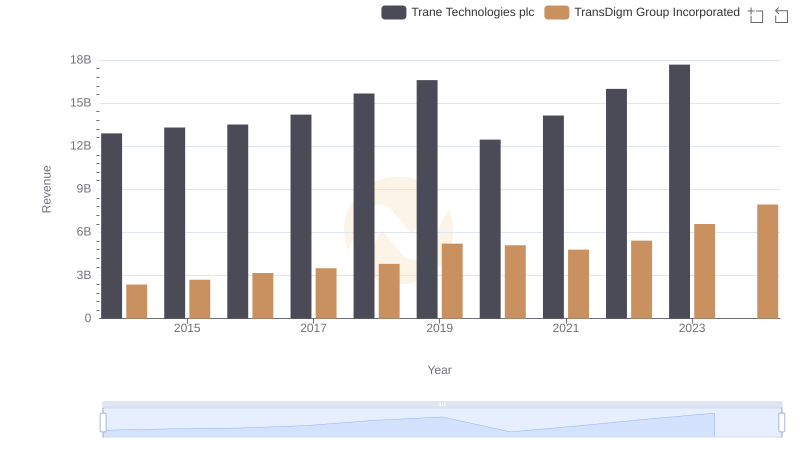
Trane Technologies plc vs TransDigm Group Incorporated: Annual Revenue Growth Compared
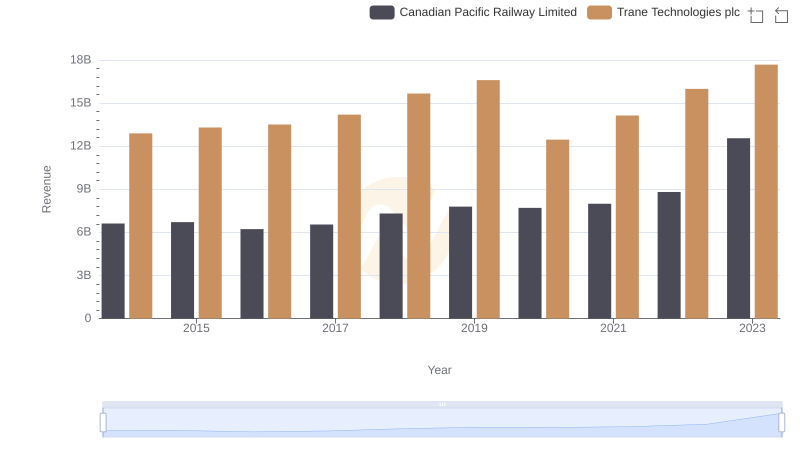
Revenue Showdown: Trane Technologies plc vs Canadian Pacific Railway Limited
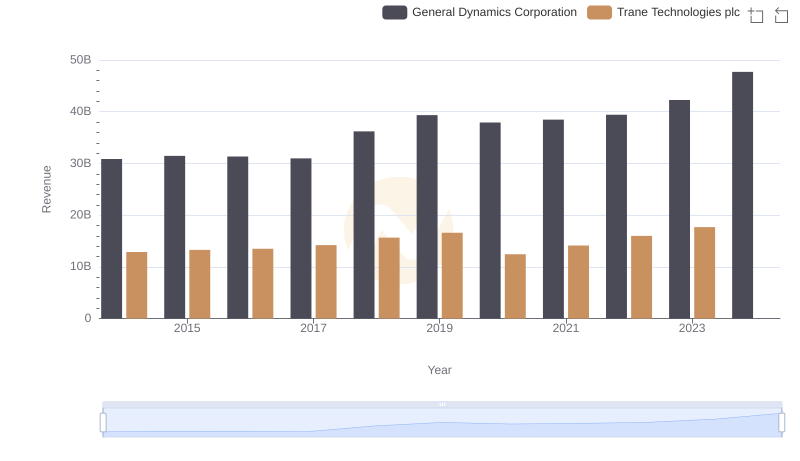
Trane Technologies plc vs General Dynamics Corporation: Annual Revenue Growth Compared
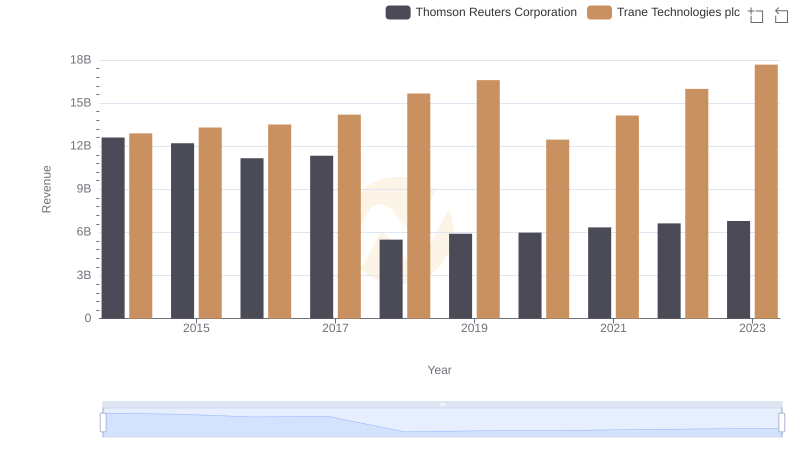
Annual Revenue Comparison: Trane Technologies plc vs Thomson Reuters Corporation
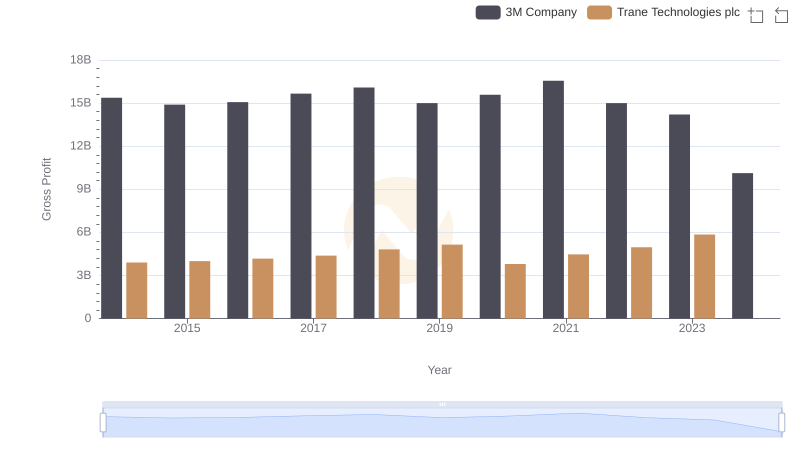
Who Generates Higher Gross Profit? Trane Technologies plc or 3M Company
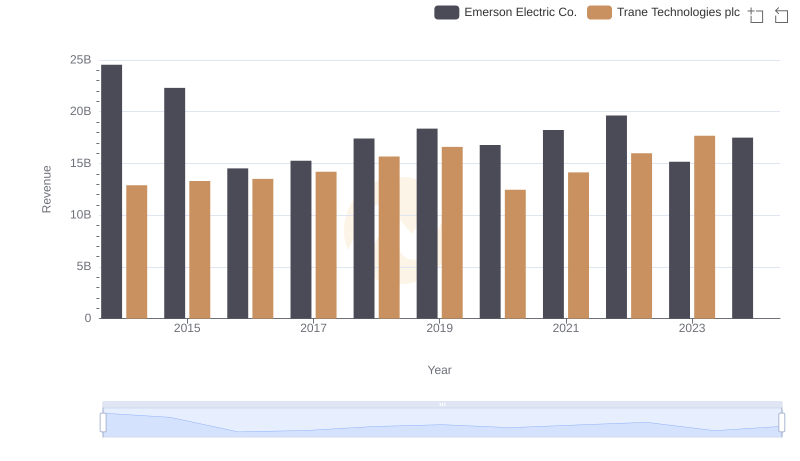
Revenue Insights: Trane Technologies plc and Emerson Electric Co. Performance Compared
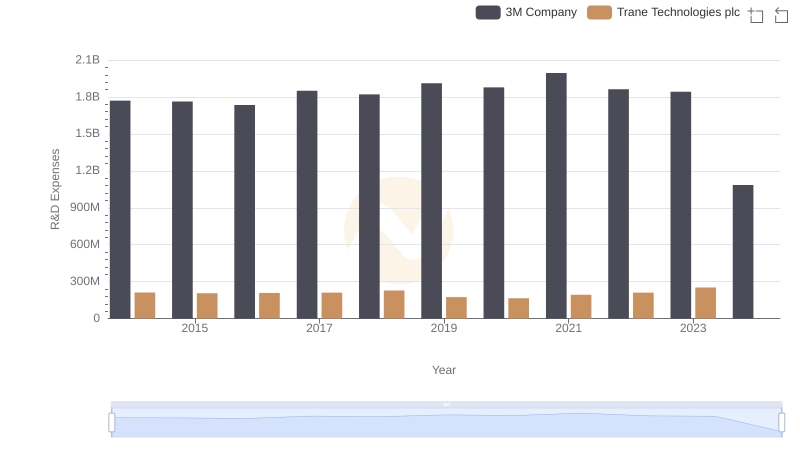
Trane Technologies plc or 3M Company: Who Invests More in Innovation?
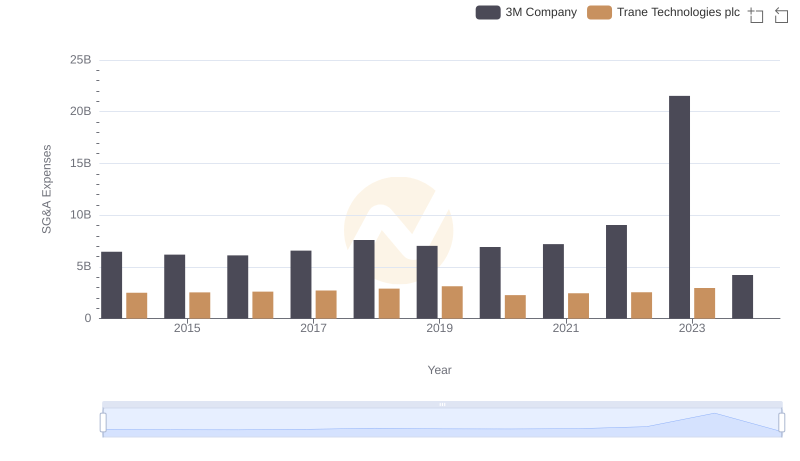
Breaking Down SG&A Expenses: Trane Technologies plc vs 3M Company