| __timestamp | Fastenal Company | The Boeing Company |
|---|---|---|
| Wednesday, January 1, 2014 | 3733507000 | 90762000000 |
| Thursday, January 1, 2015 | 3869187000 | 96114000000 |
| Friday, January 1, 2016 | 3962036000 | 94571000000 |
| Sunday, January 1, 2017 | 4390500000 | 93392000000 |
| Monday, January 1, 2018 | 4965100000 | 101127000000 |
| Tuesday, January 1, 2019 | 5333700000 | 76559000000 |
| Wednesday, January 1, 2020 | 5647300000 | 58158000000 |
| Friday, January 1, 2021 | 6010900000 | 62286000000 |
| Saturday, January 1, 2022 | 6980600000 | 66608000000 |
| Sunday, January 1, 2023 | 7346700000 | 77794000000 |
| Monday, January 1, 2024 | 7546000000 | 66517000000 |
Data in motion
In the ever-evolving landscape of American industry, The Boeing Company and Fastenal Company stand as titans in their respective fields. From 2014 to 2024, these companies have navigated economic shifts, technological advancements, and global challenges, reflected in their revenue trajectories.
Boeing, a leader in aerospace, saw its revenue peak in 2018, reaching a staggering 101 billion USD. However, the subsequent years brought challenges, with a notable dip in 2019 and 2020, reflecting a 42% decrease from its peak. By 2023, Boeing's revenue rebounded to approximately 78 billion USD, showcasing resilience in a volatile market.
Conversely, Fastenal, a key player in industrial supplies, demonstrated consistent growth. From 2014 to 2024, Fastenal's revenue increased by over 100%, reaching 7.5 billion USD in 2024. This steady ascent highlights Fastenal's robust business model and adaptability.
This analysis underscores the dynamic nature of industry leaders, with Boeing's recovery and Fastenal's growth offering valuable insights into strategic resilience and market adaptation.
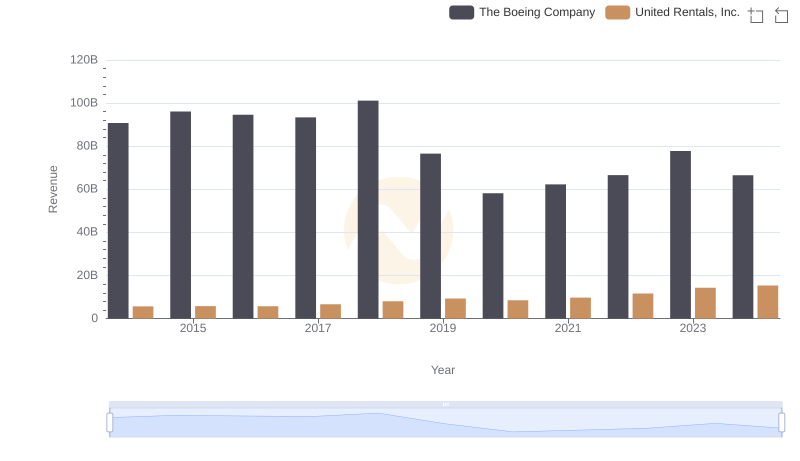
Revenue Insights: The Boeing Company and United Rentals, Inc. Performance Compared

The Boeing Company and Waste Connections, Inc.: A Comprehensive Revenue Analysis

The Boeing Company or Delta Air Lines, Inc.: Who Leads in Yearly Revenue?
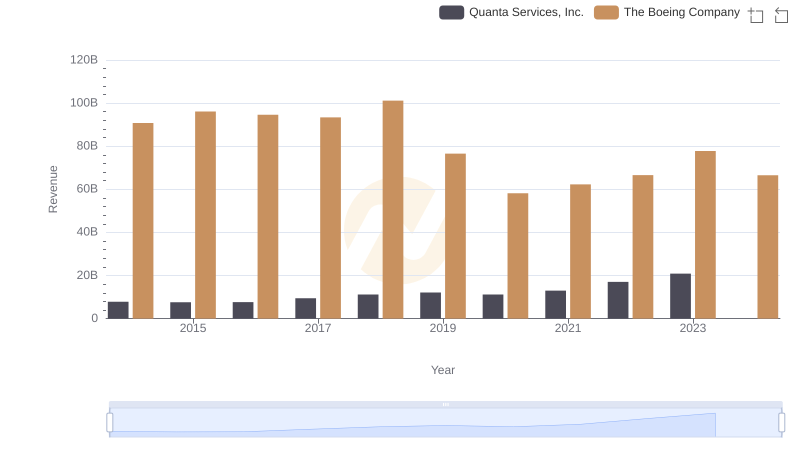
Breaking Down Revenue Trends: The Boeing Company vs Quanta Services, Inc.
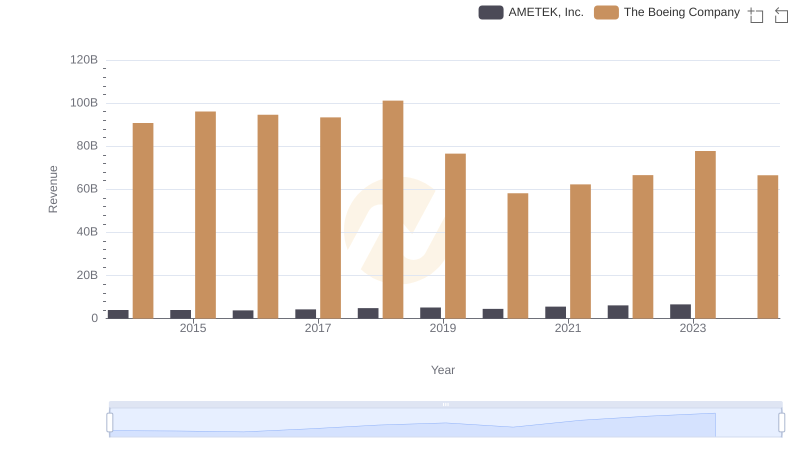
The Boeing Company and AMETEK, Inc.: A Comprehensive Revenue Analysis
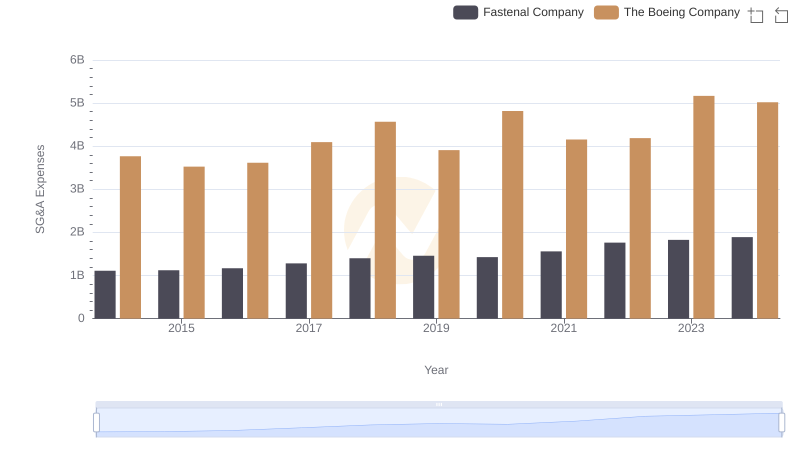
Who Optimizes SG&A Costs Better? The Boeing Company or Fastenal Company