| __timestamp | PACCAR Inc | The Boeing Company |
|---|---|---|
| Wednesday, January 1, 2014 | 18997000000 | 90762000000 |
| Thursday, January 1, 2015 | 19115100000 | 96114000000 |
| Friday, January 1, 2016 | 17033300000 | 94571000000 |
| Sunday, January 1, 2017 | 19456400000 | 93392000000 |
| Monday, January 1, 2018 | 23495700000 | 101127000000 |
| Tuesday, January 1, 2019 | 25599700000 | 76559000000 |
| Wednesday, January 1, 2020 | 18728500000 | 58158000000 |
| Friday, January 1, 2021 | 23522300000 | 62286000000 |
| Saturday, January 1, 2022 | 28819700000 | 66608000000 |
| Sunday, January 1, 2023 | 35127400000 | 77794000000 |
| Monday, January 1, 2024 | 31564300000 | 66517000000 |
Unveiling the hidden dimensions of data
In the ever-evolving landscape of the aerospace and automotive industries, The Boeing Company and PACCAR Inc have showcased intriguing revenue trajectories over the past decade. From 2014 to 2024, Boeing's revenue peaked in 2018, reaching approximately 101 billion, before experiencing a downturn, notably during the pandemic in 2020, with a 42% drop from its peak. Meanwhile, PACCAR Inc demonstrated a steady growth pattern, culminating in a 65% increase in revenue by 2023 compared to 2014.
These insights underscore the contrasting strategies and market responses of two industry titans, offering valuable lessons in resilience and adaptability.
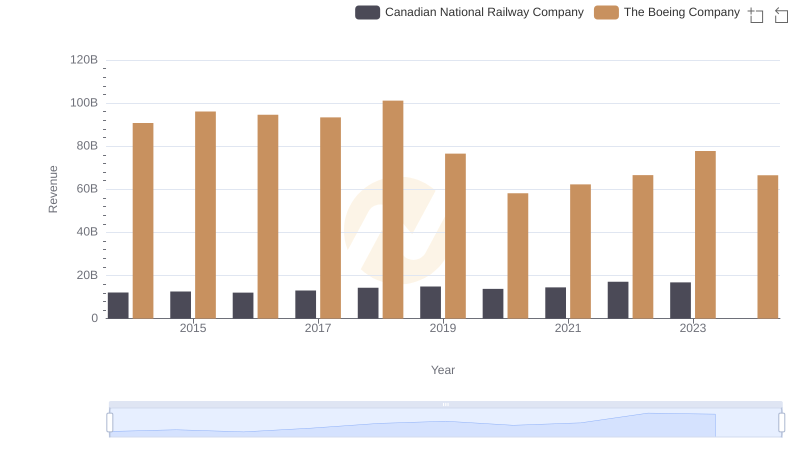
Comparing Revenue Performance: The Boeing Company or Canadian National Railway Company?
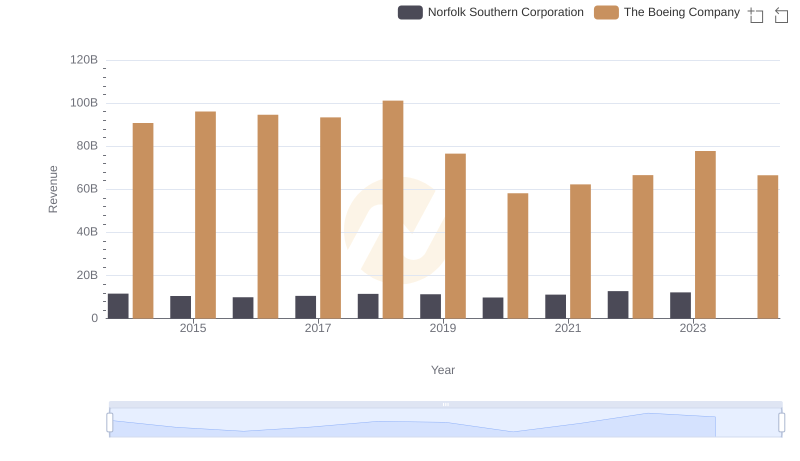
Who Generates More Revenue? The Boeing Company or Norfolk Southern Corporation
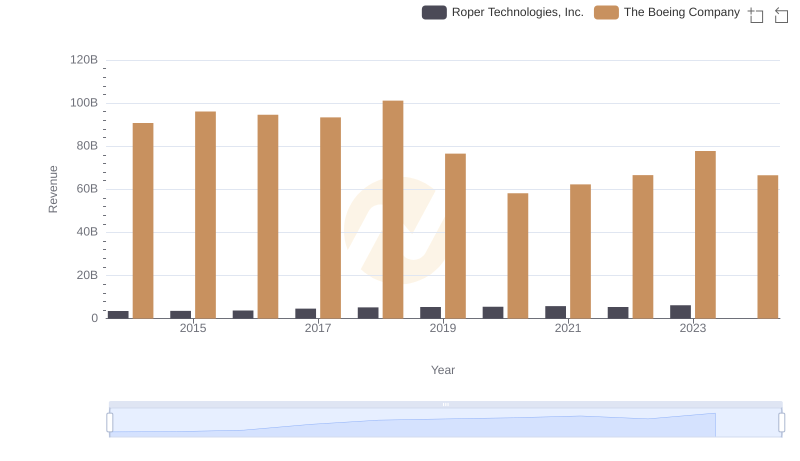
Revenue Insights: The Boeing Company and Roper Technologies, Inc. Performance Compared
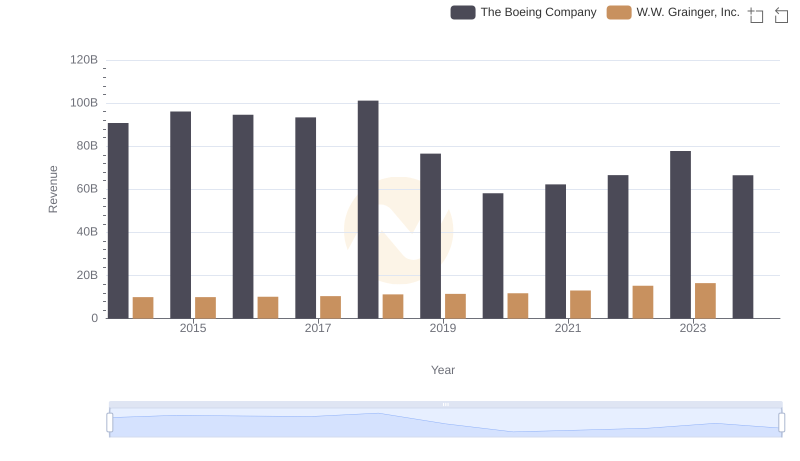
Comparing Revenue Performance: The Boeing Company or W.W. Grainger, Inc.?
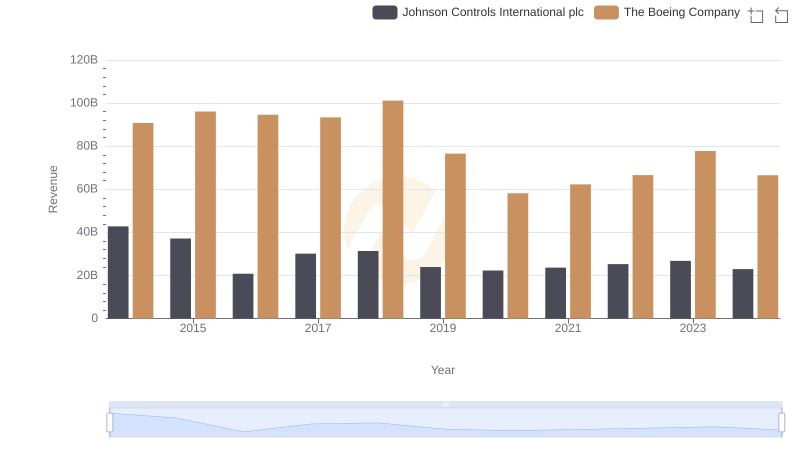
The Boeing Company vs Johnson Controls International plc: Examining Key Revenue Metrics
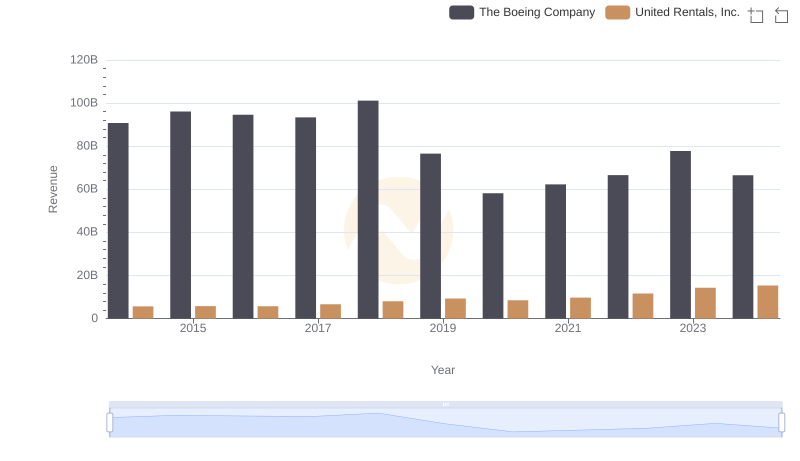
Revenue Insights: The Boeing Company and United Rentals, Inc. Performance Compared
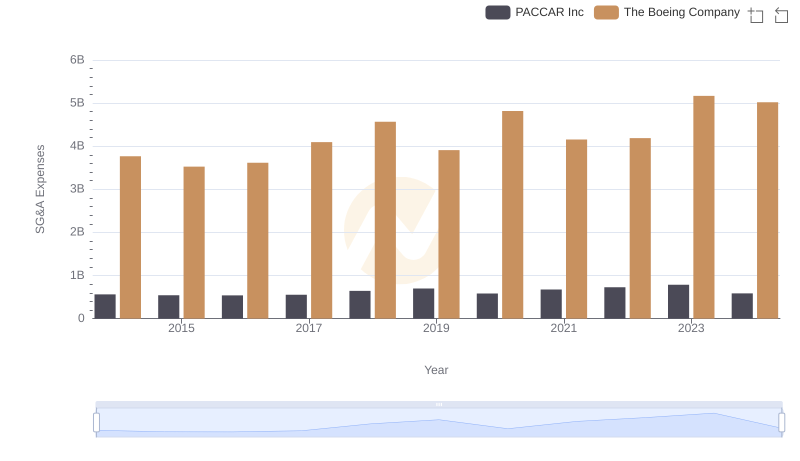
Who Optimizes SG&A Costs Better? The Boeing Company or PACCAR Inc