| __timestamp | Cintas Corporation | Parker-Hannifin Corporation |
|---|---|---|
| Wednesday, January 1, 2014 | 1302752000 | 1633992000 |
| Thursday, January 1, 2015 | 1224930000 | 1544746000 |
| Friday, January 1, 2016 | 1348122000 | 1359360000 |
| Sunday, January 1, 2017 | 1527380000 | 1453935000 |
| Monday, January 1, 2018 | 1916792000 | 1657152000 |
| Tuesday, January 1, 2019 | 1980644000 | 1543939000 |
| Wednesday, January 1, 2020 | 2071052000 | 1656553000 |
| Friday, January 1, 2021 | 1929159000 | 1527302000 |
| Saturday, January 1, 2022 | 2044876000 | 1627116000 |
| Sunday, January 1, 2023 | 2370704000 | 3354103000 |
| Monday, January 1, 2024 | 2617783000 | 3315177000 |
Data in motion
In the ever-evolving landscape of corporate finance, understanding the spending patterns of industry giants can offer valuable insights. Parker-Hannifin Corporation and Cintas Corporation, two stalwarts in their respective fields, have shown intriguing trends in their Selling, General, and Administrative (SG&A) expenses over the past decade.
From 2014 to 2024, Cintas Corporation's SG&A expenses have grown by approximately 100%, reflecting a strategic expansion and investment in operational efficiencies. In contrast, Parker-Hannifin Corporation experienced a significant spike in 2023, with expenses surging by over 100% compared to the previous year, possibly indicating a major acquisition or restructuring.
These patterns not only highlight the dynamic nature of corporate strategies but also underscore the importance of SG&A management in maintaining competitive advantage. As we move forward, monitoring these trends will be crucial for stakeholders and investors alike.
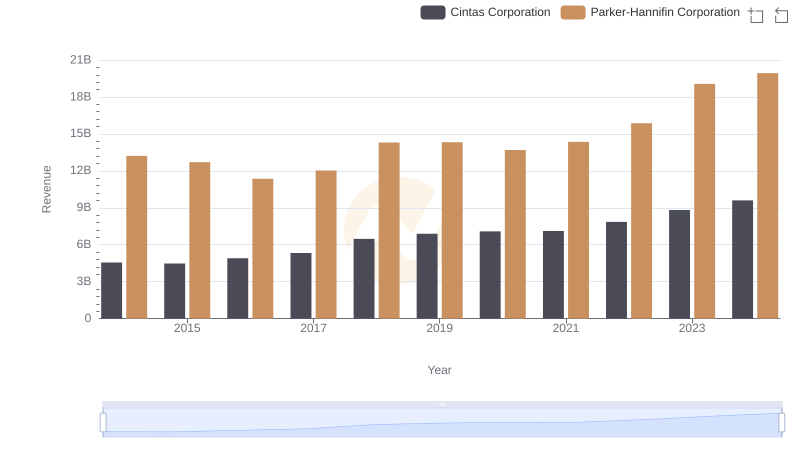
Revenue Showdown: Parker-Hannifin Corporation vs Cintas Corporation
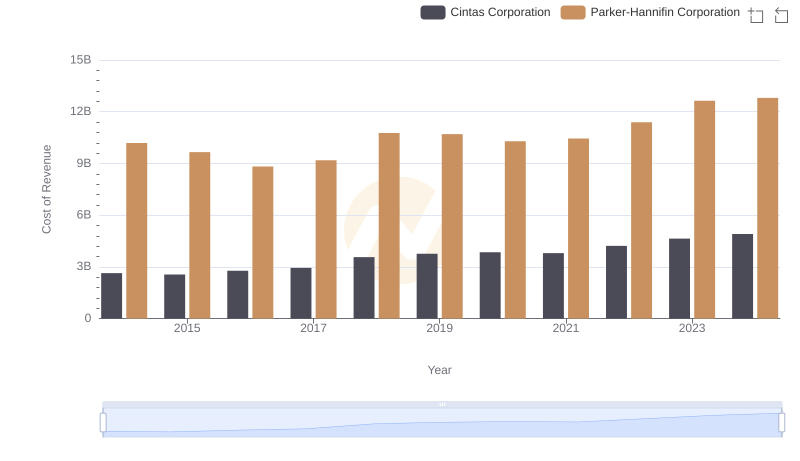
Cost Insights: Breaking Down Parker-Hannifin Corporation and Cintas Corporation's Expenses
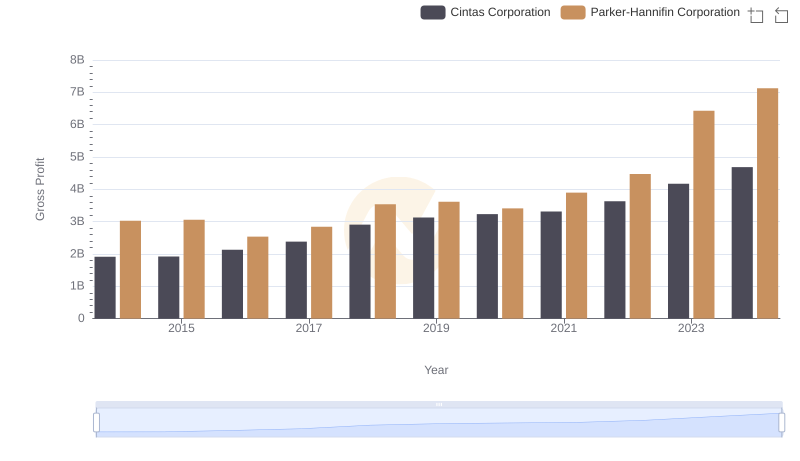
Parker-Hannifin Corporation vs Cintas Corporation: A Gross Profit Performance Breakdown
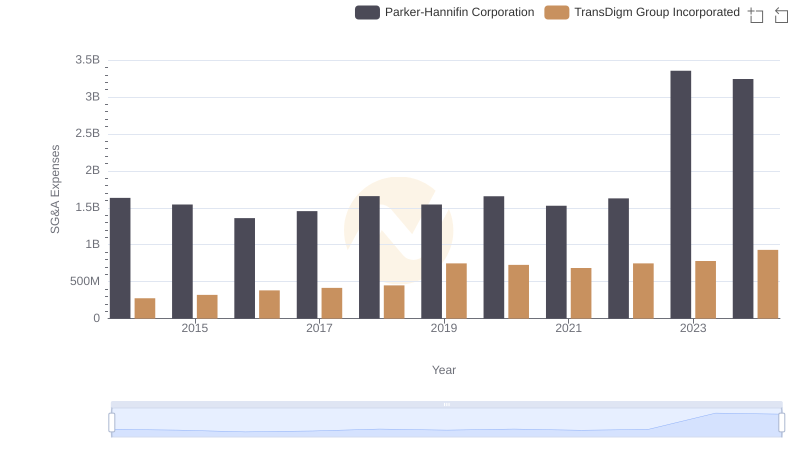
SG&A Efficiency Analysis: Comparing Parker-Hannifin Corporation and TransDigm Group Incorporated
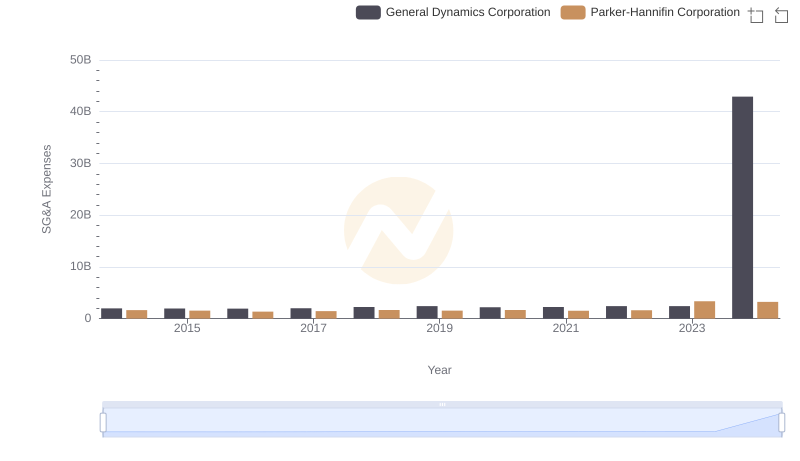
Operational Costs Compared: SG&A Analysis of Parker-Hannifin Corporation and General Dynamics Corporation
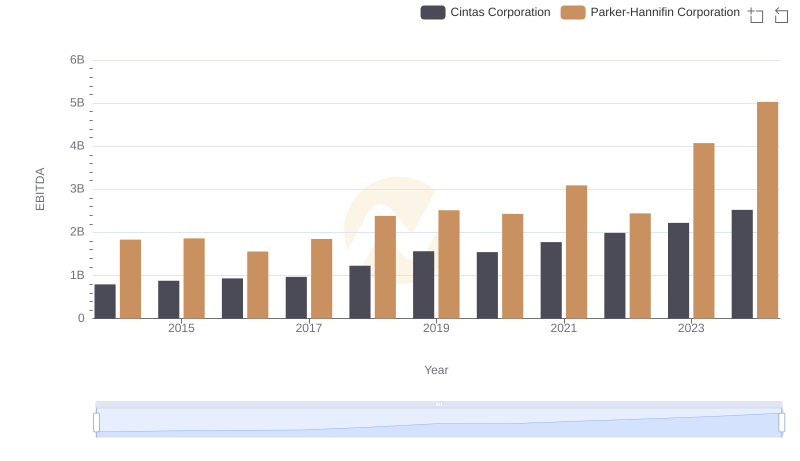
A Side-by-Side Analysis of EBITDA: Parker-Hannifin Corporation and Cintas Corporation
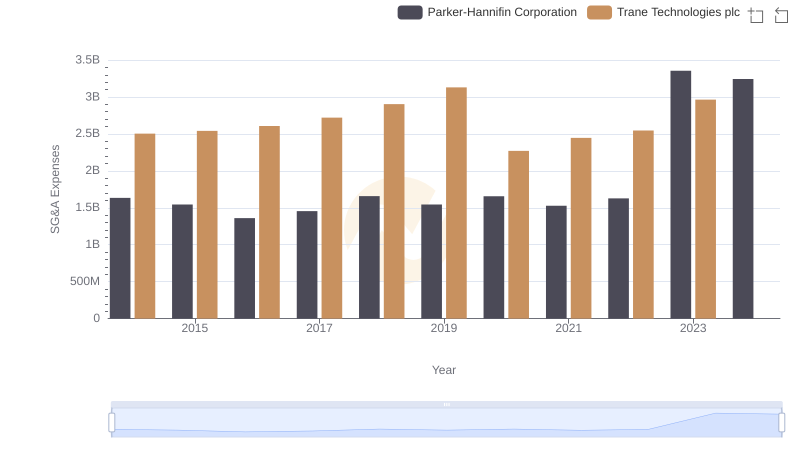
Parker-Hannifin Corporation vs Trane Technologies plc: SG&A Expense Trends
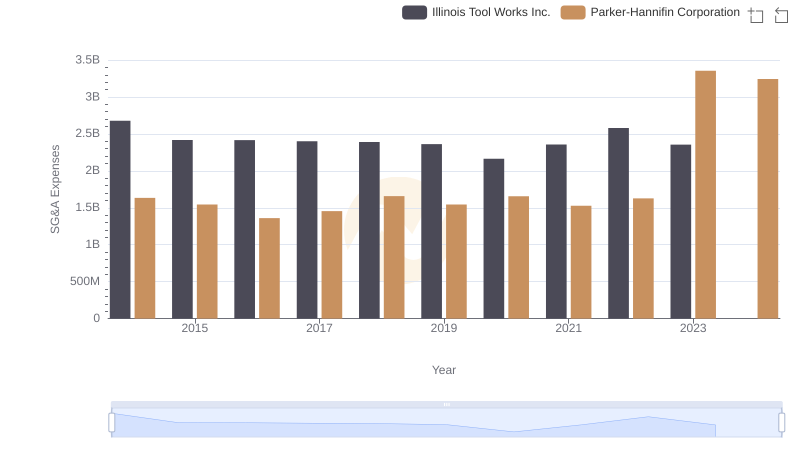
Breaking Down SG&A Expenses: Parker-Hannifin Corporation vs Illinois Tool Works Inc.
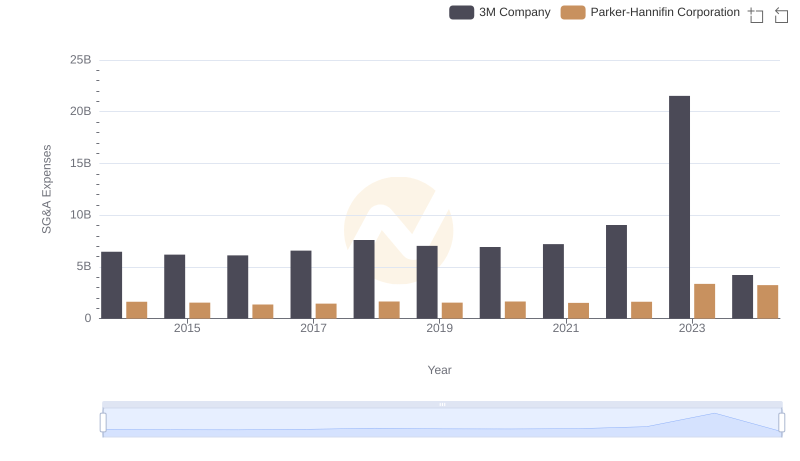
Parker-Hannifin Corporation and 3M Company: SG&A Spending Patterns Compared
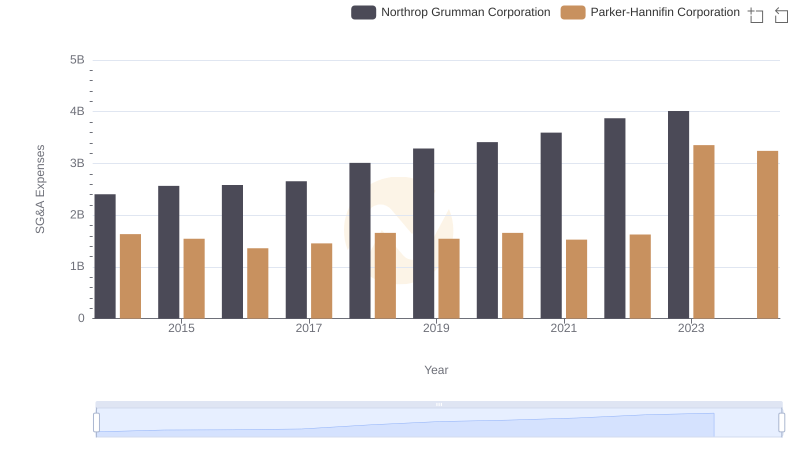
SG&A Efficiency Analysis: Comparing Parker-Hannifin Corporation and Northrop Grumman Corporation