| __timestamp | Parker-Hannifin Corporation | TransDigm Group Incorporated |
|---|---|---|
| Wednesday, January 1, 2014 | 1832903000 | 892583000 |
| Thursday, January 1, 2015 | 1861551000 | 1157465000 |
| Friday, January 1, 2016 | 1558088000 | 1388030000 |
| Sunday, January 1, 2017 | 1846306000 | 1616889000 |
| Monday, January 1, 2018 | 2382235000 | 1654961000 |
| Tuesday, January 1, 2019 | 2513468000 | 2153332000 |
| Wednesday, January 1, 2020 | 2431500000 | 2046000000 |
| Friday, January 1, 2021 | 3092383000 | 2065000000 |
| Saturday, January 1, 2022 | 2441242000 | 2457000000 |
| Sunday, January 1, 2023 | 4071687000 | 3212000000 |
| Monday, January 1, 2024 | 5028229000 | 3869000000 |
Unleashing insights
In the competitive landscape of industrial manufacturing, Parker-Hannifin Corporation and TransDigm Group Incorporated have been pivotal players. Over the past decade, Parker-Hannifin has demonstrated a robust growth trajectory in EBITDA, with a remarkable 175% increase from 2014 to 2024. This growth is highlighted by a significant leap in 2023, where EBITDA surged by 67% compared to the previous year. Meanwhile, TransDigm Group has also shown a commendable performance, with a 334% increase in EBITDA over the same period. Notably, 2023 marked a pivotal year for TransDigm, with a 31% rise in EBITDA from 2022. These figures underscore the resilience and strategic prowess of both companies in navigating economic challenges and capitalizing on market opportunities. As we look to the future, the trajectory of these industry giants will be closely watched by investors and analysts alike.

Who Generates More Revenue? Parker-Hannifin Corporation or TransDigm Group Incorporated
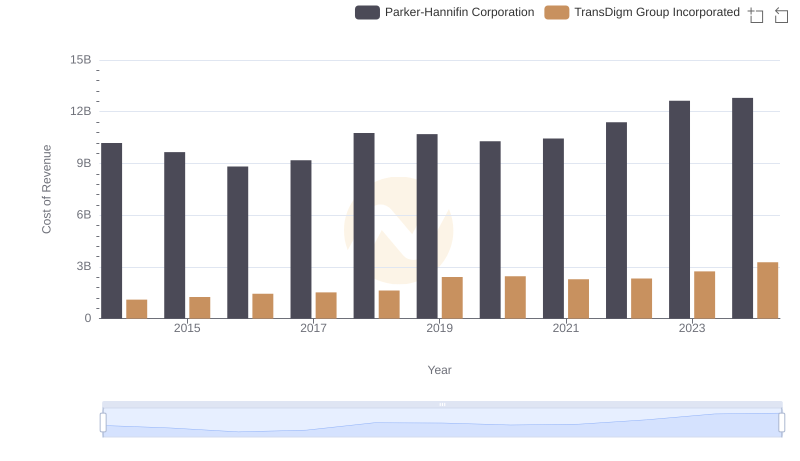
Analyzing Cost of Revenue: Parker-Hannifin Corporation and TransDigm Group Incorporated

Key Insights on Gross Profit: Parker-Hannifin Corporation vs TransDigm Group Incorporated
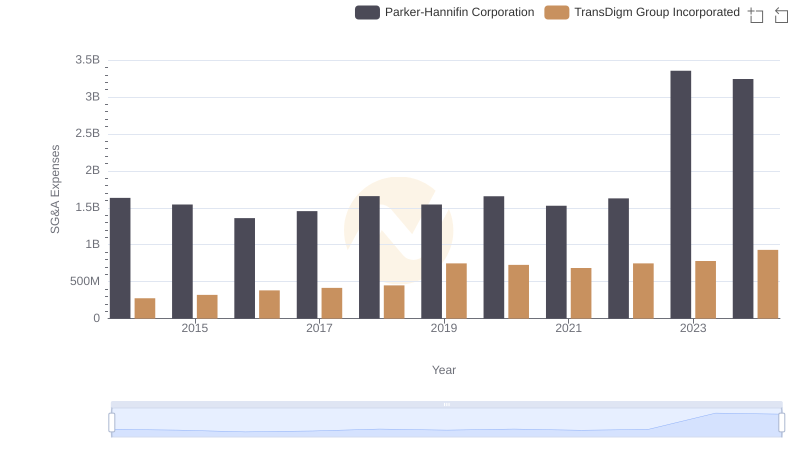
SG&A Efficiency Analysis: Comparing Parker-Hannifin Corporation and TransDigm Group Incorporated
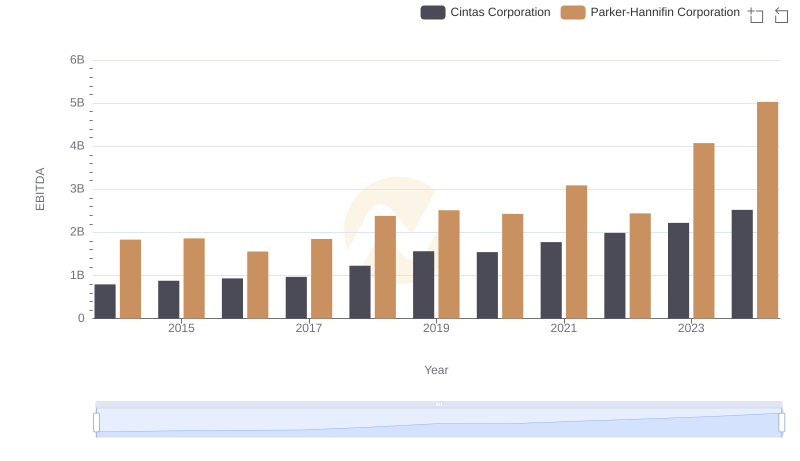
A Side-by-Side Analysis of EBITDA: Parker-Hannifin Corporation and Cintas Corporation
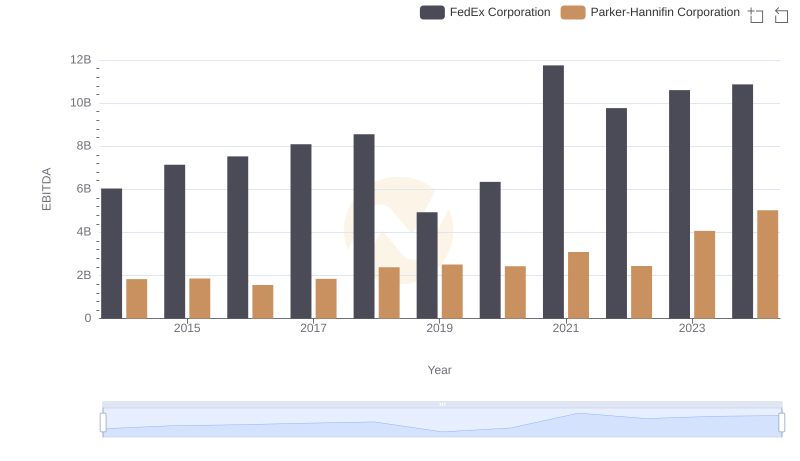
A Side-by-Side Analysis of EBITDA: Parker-Hannifin Corporation and FedEx Corporation
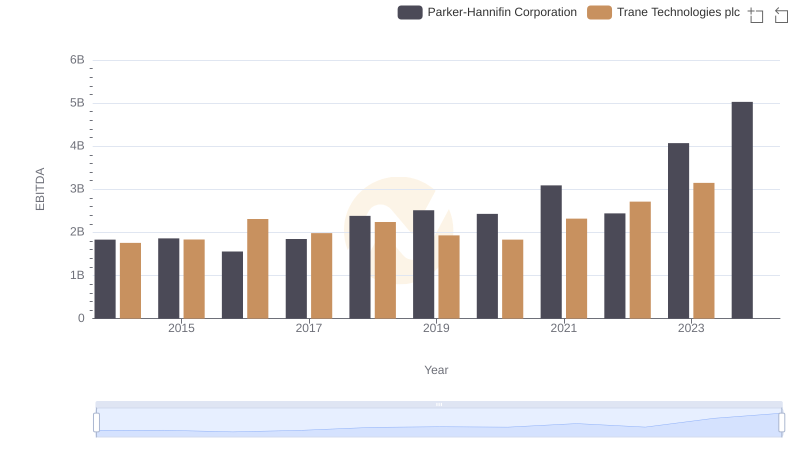
EBITDA Analysis: Evaluating Parker-Hannifin Corporation Against Trane Technologies plc

EBITDA Metrics Evaluated: Parker-Hannifin Corporation vs Illinois Tool Works Inc.
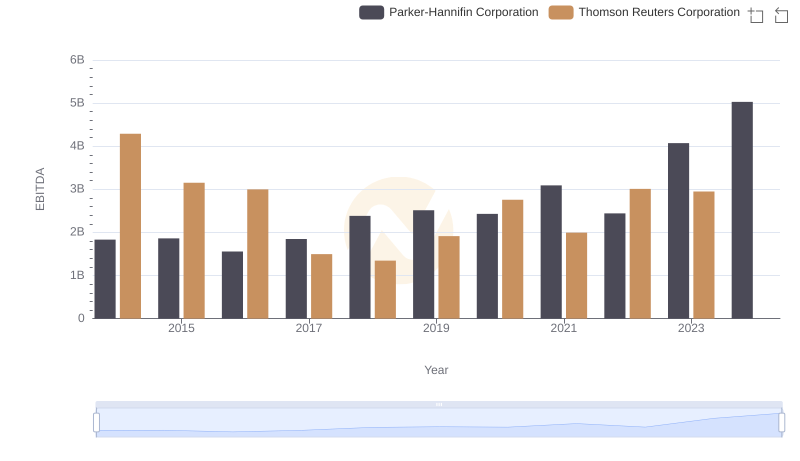
Parker-Hannifin Corporation vs Thomson Reuters Corporation: In-Depth EBITDA Performance Comparison