| __timestamp | CyberArk Software Ltd. | Intuit Inc. |
|---|---|---|
| Wednesday, January 1, 2014 | 53438000 | 1762000000 |
| Thursday, January 1, 2015 | 83196000 | 1771000000 |
| Friday, January 1, 2016 | 115892000 | 1807000000 |
| Sunday, January 1, 2017 | 157138000 | 1973000000 |
| Monday, January 1, 2018 | 190334000 | 2298000000 |
| Tuesday, January 1, 2019 | 236476000 | 2524000000 |
| Wednesday, January 1, 2020 | 280428000 | 2727000000 |
| Friday, January 1, 2021 | 345826000 | 3626000000 |
| Saturday, January 1, 2022 | 427793000 | 4986000000 |
| Sunday, January 1, 2023 | 500784000 | 5062000000 |
| Monday, January 1, 2024 | 593210000 | 5730000000 |
Unveiling the hidden dimensions of data
In the ever-evolving landscape of financial management, understanding the efficiency of Selling, General, and Administrative (SG&A) expenses is crucial. This analysis compares two industry giants: Intuit Inc. and CyberArk Software Ltd., from 2014 to 2023.
Intuit Inc. has shown a consistent increase in SG&A expenses, growing by approximately 187% over the decade. This reflects their strategic investments in marketing and administrative capabilities, crucial for maintaining their market leadership in financial software.
CyberArk Software Ltd. has experienced a staggering 837% increase in SG&A expenses, indicating aggressive expansion and investment in sales and administrative functions. This growth underscores their commitment to scaling operations and enhancing market presence.
While the data for 2024 is incomplete for CyberArk, Intuit's figures continue to rise, suggesting ongoing strategic investments.

Who Generates More Revenue? Intuit Inc. or CyberArk Software Ltd.
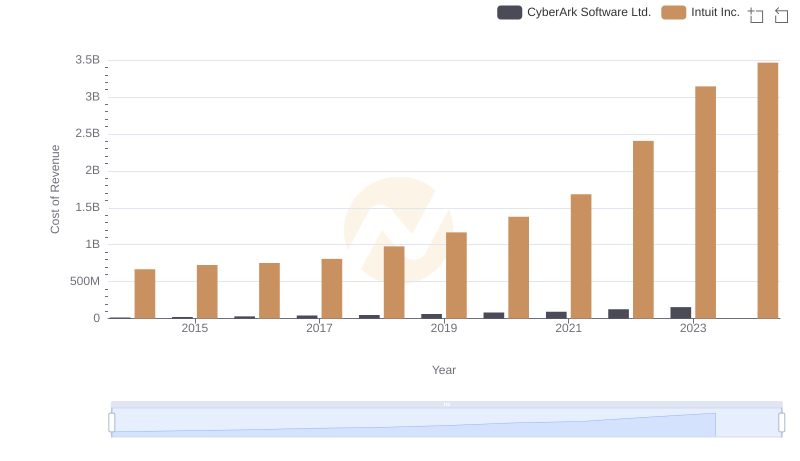
Cost of Revenue Trends: Intuit Inc. vs CyberArk Software Ltd.
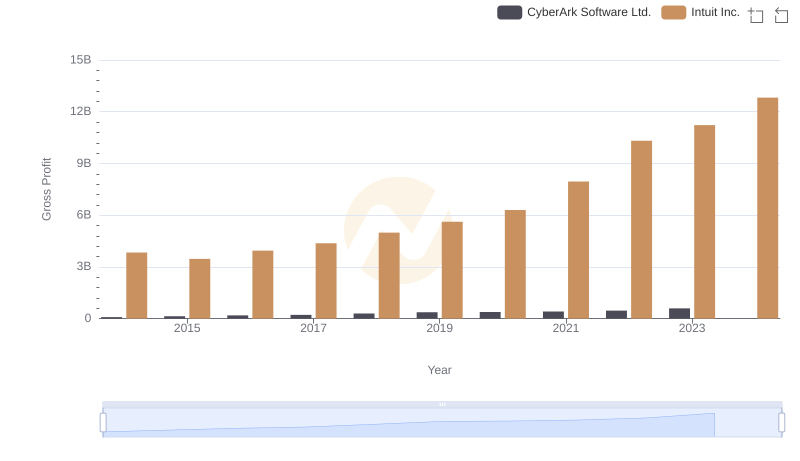
Gross Profit Analysis: Comparing Intuit Inc. and CyberArk Software Ltd.
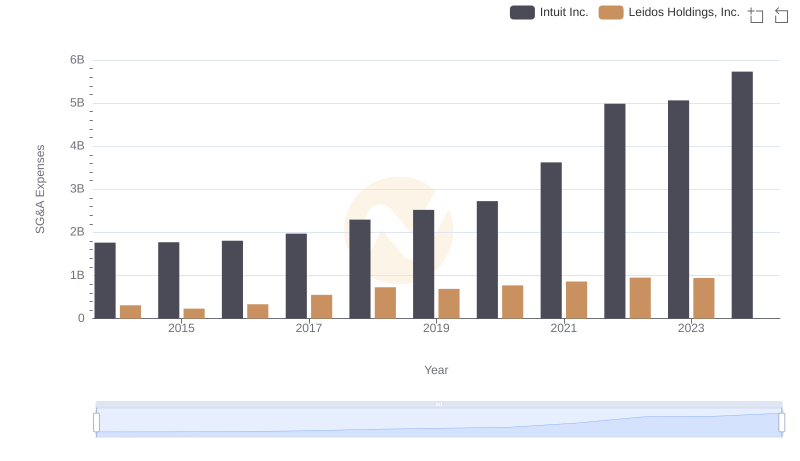
Operational Costs Compared: SG&A Analysis of Intuit Inc. and Leidos Holdings, Inc.
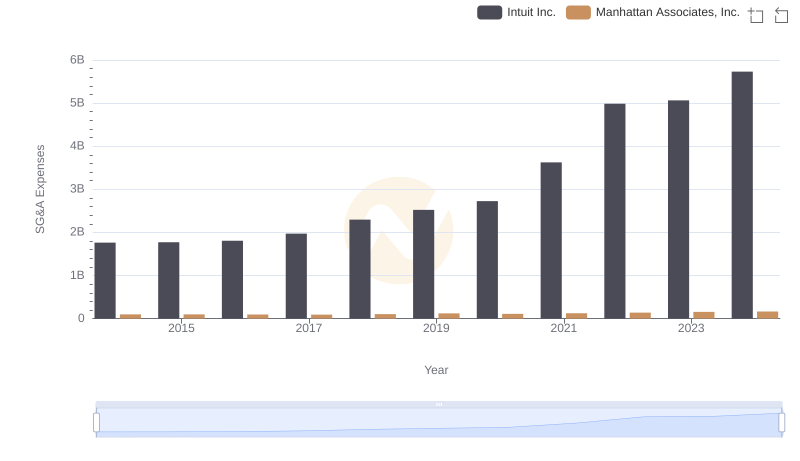
Intuit Inc. vs Manhattan Associates, Inc.: SG&A Expense Trends
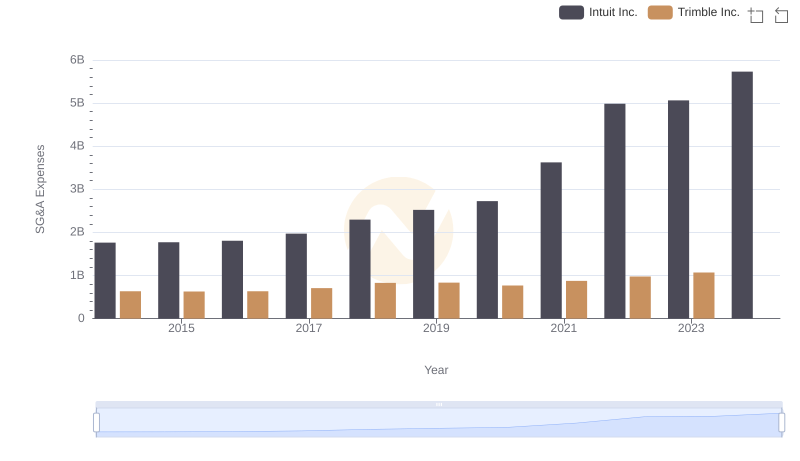
Intuit Inc. or Trimble Inc.: Who Manages SG&A Costs Better?
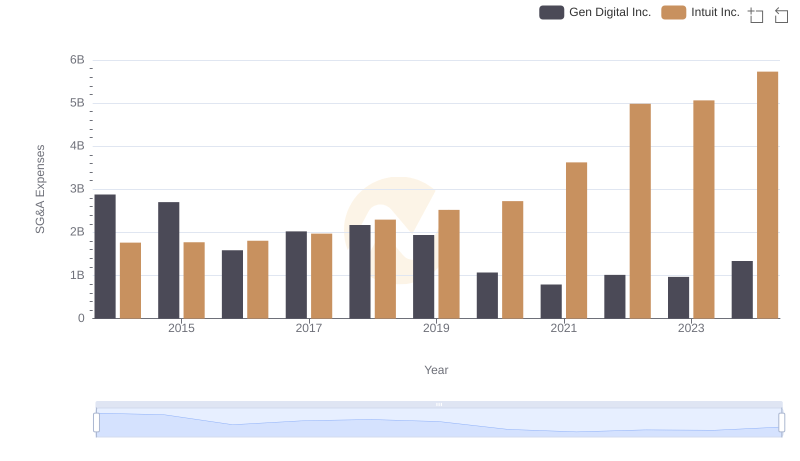
Breaking Down SG&A Expenses: Intuit Inc. vs Gen Digital Inc.
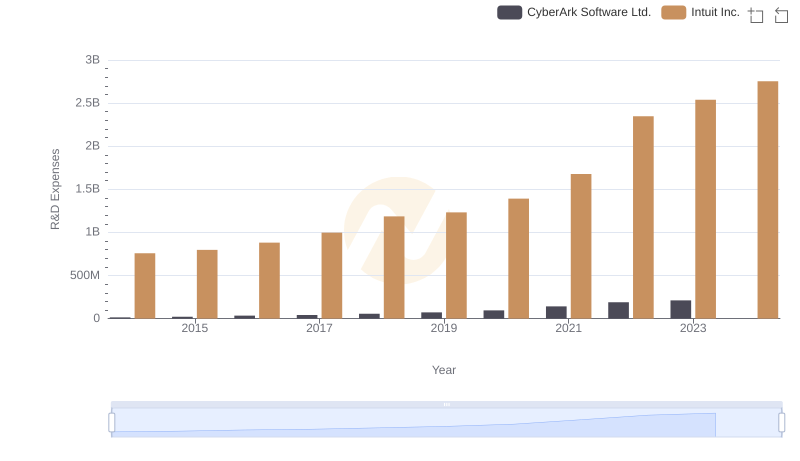
Research and Development Expenses Breakdown: Intuit Inc. vs CyberArk Software Ltd.
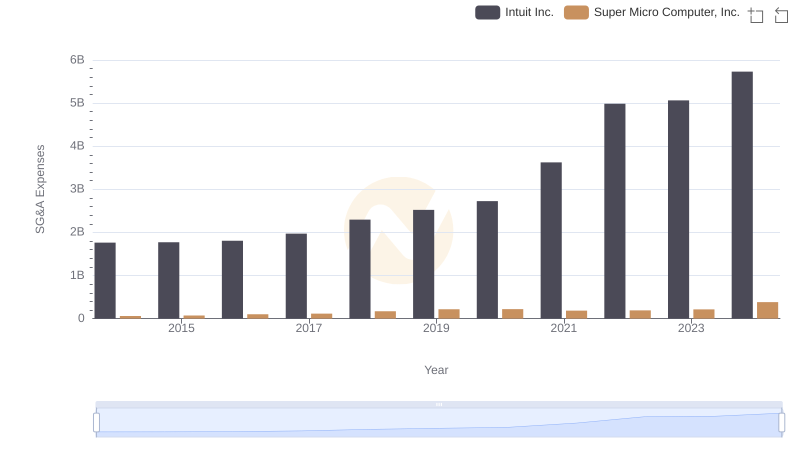
Operational Costs Compared: SG&A Analysis of Intuit Inc. and Super Micro Computer, Inc.
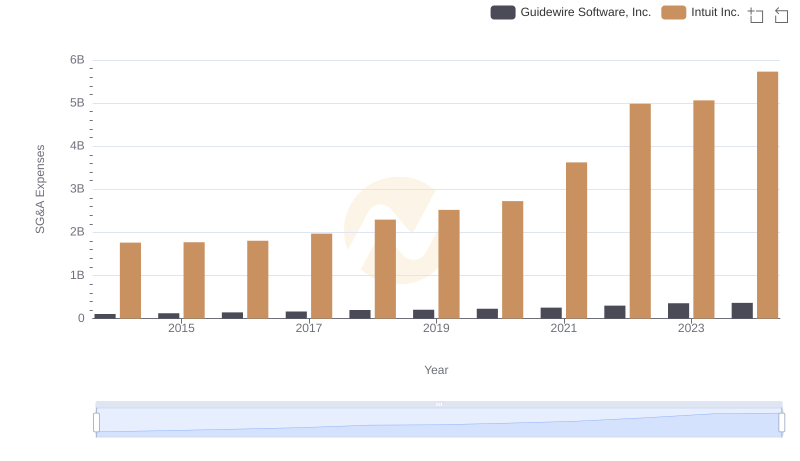
Selling, General, and Administrative Costs: Intuit Inc. vs Guidewire Software, Inc.
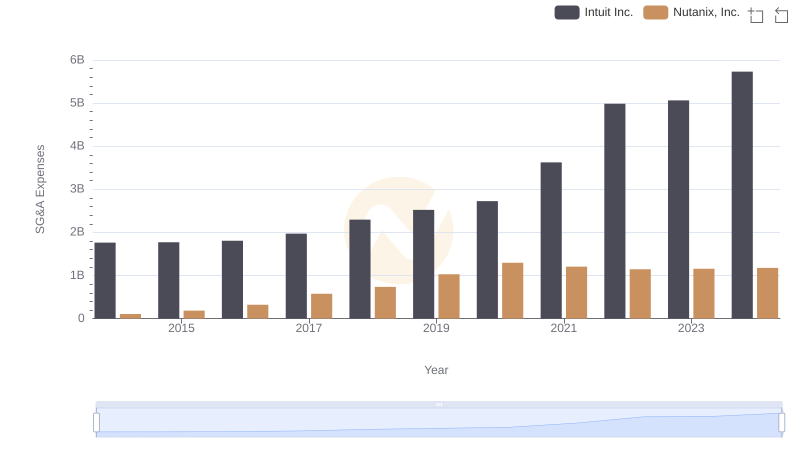
Who Optimizes SG&A Costs Better? Intuit Inc. or Nutanix, Inc.
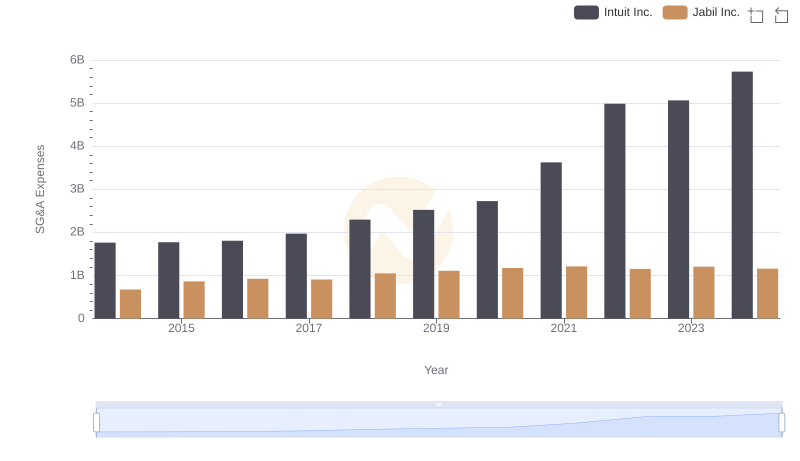
Intuit Inc. vs Jabil Inc.: SG&A Expense Trends