| __timestamp | Ingersoll Rand Inc. | United Airlines Holdings, Inc. |
|---|---|---|
| Wednesday, January 1, 2014 | 476000000 | 1373000000 |
| Thursday, January 1, 2015 | 427000000 | 1342000000 |
| Friday, January 1, 2016 | 414339000 | 1303000000 |
| Sunday, January 1, 2017 | 446600000 | 1349000000 |
| Monday, January 1, 2018 | 434600000 | 1558000000 |
| Tuesday, January 1, 2019 | 436400000 | 1651000000 |
| Wednesday, January 1, 2020 | 894800000 | 459000000 |
| Friday, January 1, 2021 | 1028000000 | 677000000 |
| Saturday, January 1, 2022 | 1095800000 | 1535000000 |
| Sunday, January 1, 2023 | 1272700000 | 1977000000 |
| Monday, January 1, 2024 | 0 | 2231000000 |
In pursuit of knowledge
In the ever-evolving landscape of corporate finance, understanding the efficiency of Selling, General, and Administrative (SG&A) expenses is crucial. This analysis juxtaposes Ingersoll Rand Inc., a leader in industrial manufacturing, with United Airlines Holdings, Inc., a titan in the aviation sector, from 2014 to 2023.
Ingersoll Rand Inc. demonstrated a steady increase in SG&A efficiency, with expenses rising from approximately 414 million in 2016 to 1.27 billion by 2023. This represents a significant growth of over 200%, reflecting strategic investments and operational scaling. Conversely, United Airlines experienced a more volatile trajectory. Notably, SG&A expenses plummeted to 459 million in 2020, likely due to pandemic-induced disruptions, before rebounding to nearly 2 billion in 2023.
This comparative analysis highlights the distinct financial strategies and challenges faced by these industry giants, offering valuable insights for investors and stakeholders.
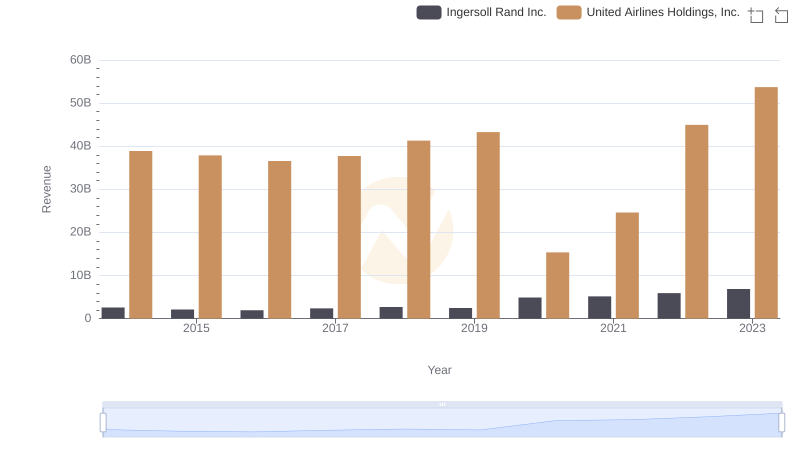
Ingersoll Rand Inc. or United Airlines Holdings, Inc.: Who Leads in Yearly Revenue?
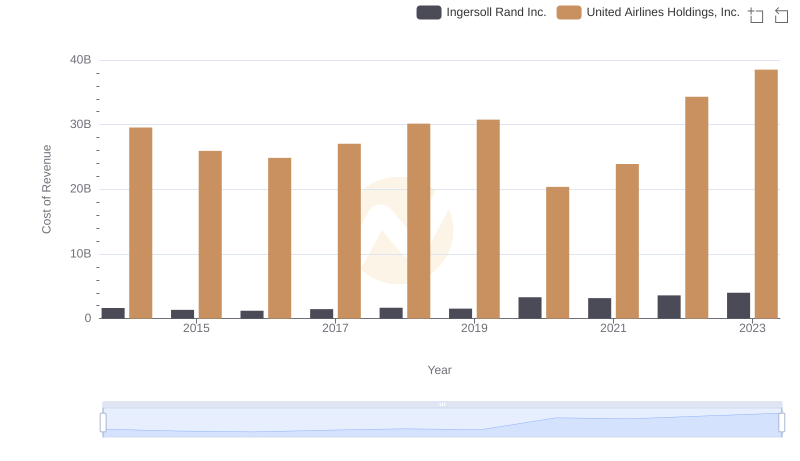
Cost Insights: Breaking Down Ingersoll Rand Inc. and United Airlines Holdings, Inc.'s Expenses
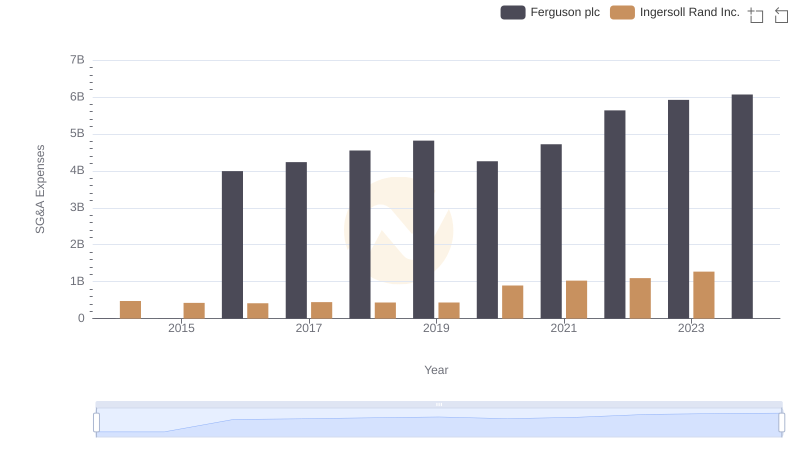
Operational Costs Compared: SG&A Analysis of Ingersoll Rand Inc. and Ferguson plc
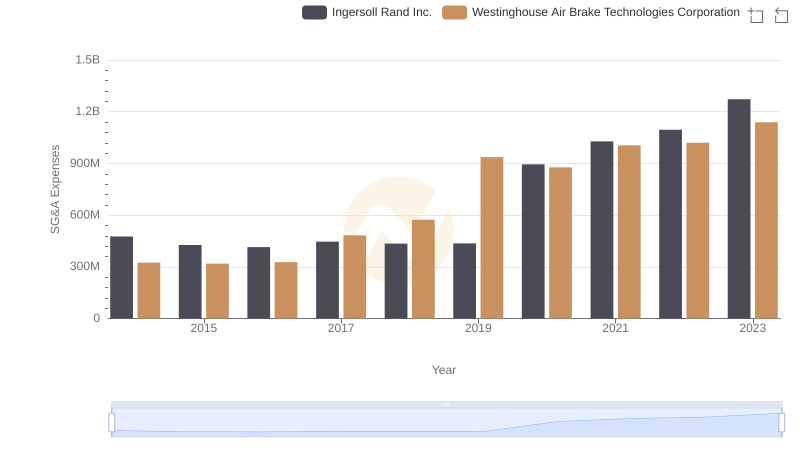
Comparing SG&A Expenses: Ingersoll Rand Inc. vs Westinghouse Air Brake Technologies Corporation Trends and Insights
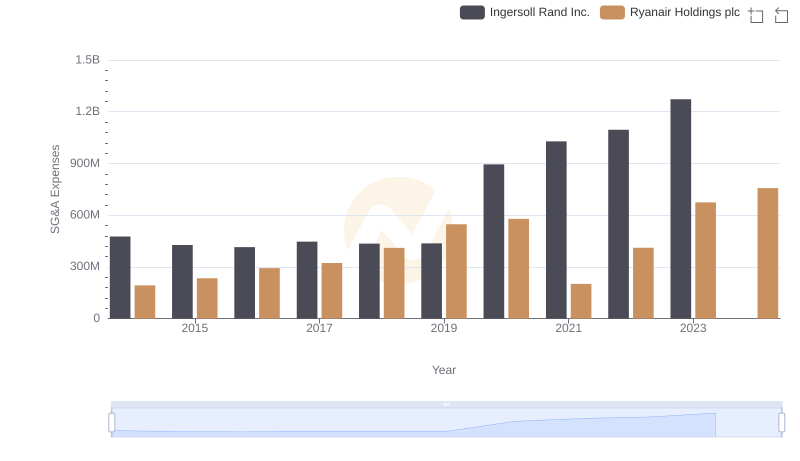
Ingersoll Rand Inc. or Ryanair Holdings plc: Who Manages SG&A Costs Better?
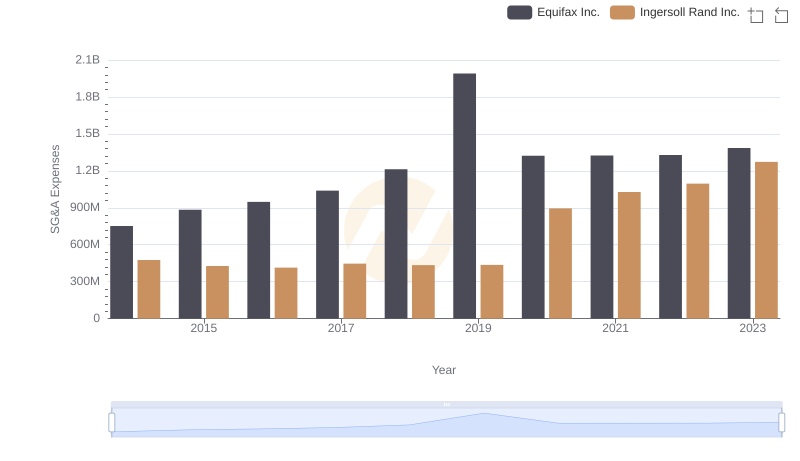
Ingersoll Rand Inc. or Equifax Inc.: Who Manages SG&A Costs Better?
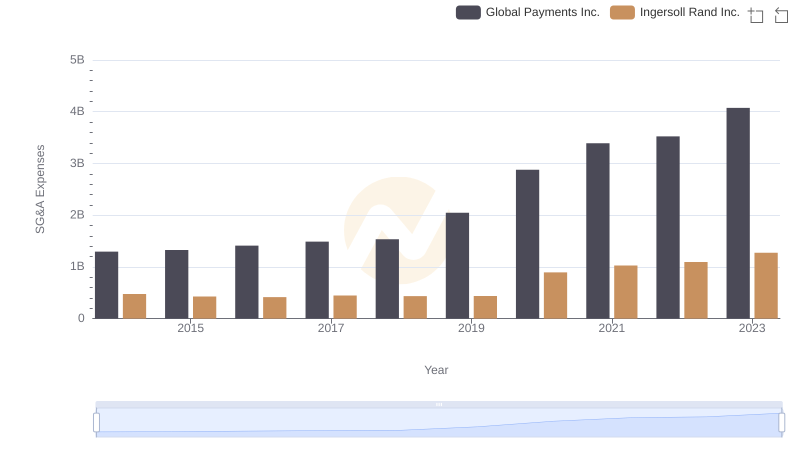
Cost Management Insights: SG&A Expenses for Ingersoll Rand Inc. and Global Payments Inc.
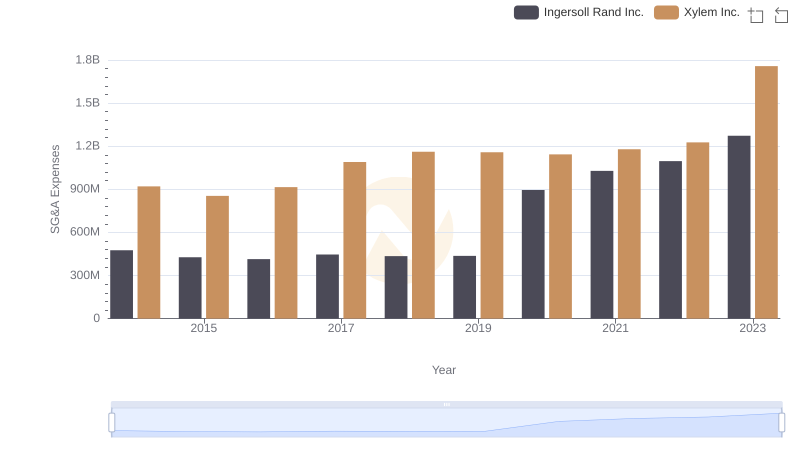
Operational Costs Compared: SG&A Analysis of Ingersoll Rand Inc. and Xylem Inc.
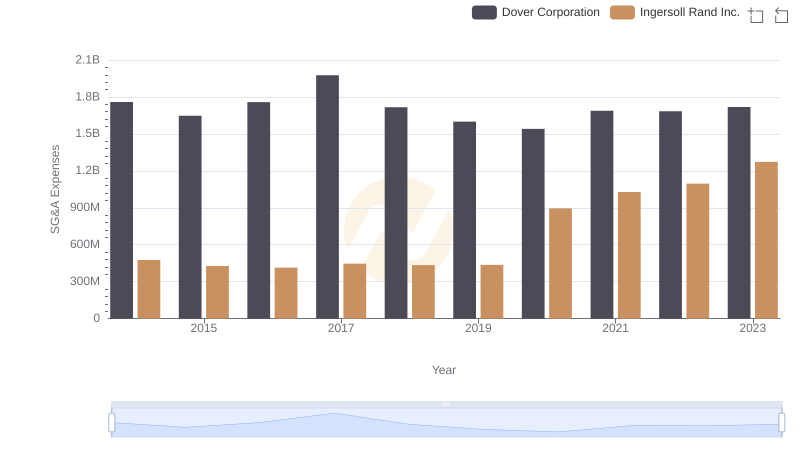
SG&A Efficiency Analysis: Comparing Ingersoll Rand Inc. and Dover Corporation
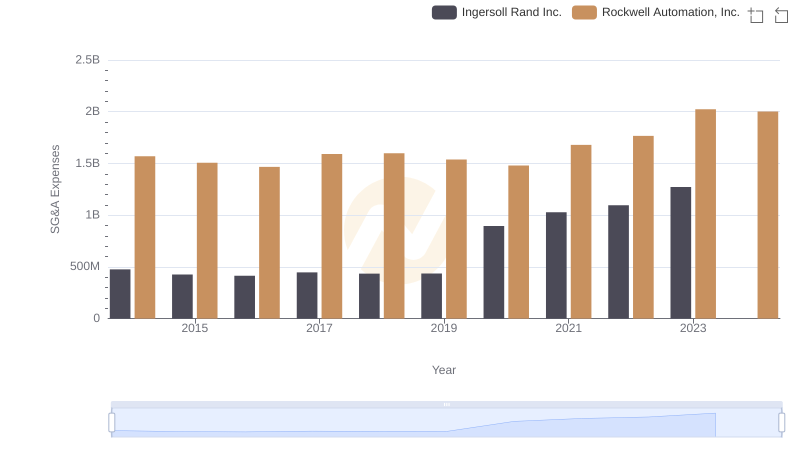
Comparing SG&A Expenses: Ingersoll Rand Inc. vs Rockwell Automation, Inc. Trends and Insights

Cost Management Insights: SG&A Expenses for Ingersoll Rand Inc. and Builders FirstSource, Inc.