| __timestamp | Ingersoll Rand Inc. | Xylem Inc. |
|---|---|---|
| Wednesday, January 1, 2014 | 476000000 | 920000000 |
| Thursday, January 1, 2015 | 427000000 | 854000000 |
| Friday, January 1, 2016 | 414339000 | 915000000 |
| Sunday, January 1, 2017 | 446600000 | 1090000000 |
| Monday, January 1, 2018 | 434600000 | 1161000000 |
| Tuesday, January 1, 2019 | 436400000 | 1158000000 |
| Wednesday, January 1, 2020 | 894800000 | 1143000000 |
| Friday, January 1, 2021 | 1028000000 | 1179000000 |
| Saturday, January 1, 2022 | 1095800000 | 1227000000 |
| Sunday, January 1, 2023 | 1272700000 | 1757000000 |
| Monday, January 1, 2024 | 0 |
Unleashing the power of data
In the ever-evolving landscape of industrial giants, operational efficiency is paramount. Over the past decade, Ingersoll Rand Inc. and Xylem Inc. have showcased contrasting trajectories in their Selling, General, and Administrative (SG&A) expenses. From 2014 to 2023, Xylem Inc. consistently outpaced Ingersoll Rand in SG&A spending, peaking in 2023 with a 51% higher expenditure. Notably, Ingersoll Rand's expenses surged by 167% from 2014 to 2023, reflecting strategic investments or operational shifts. Meanwhile, Xylem's expenses grew by 91%, indicating a steady expansion. This analysis underscores the importance of cost management in maintaining competitive advantage. As these companies navigate the complexities of the global market, their financial strategies offer valuable insights into the balance between growth and efficiency.
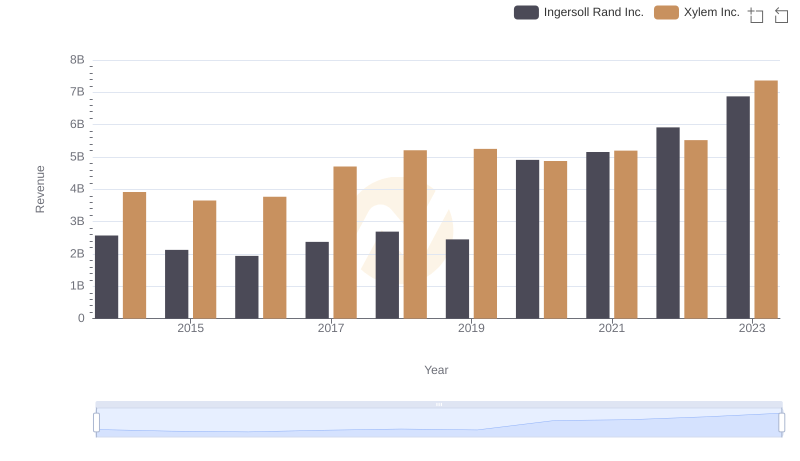
Revenue Insights: Ingersoll Rand Inc. and Xylem Inc. Performance Compared
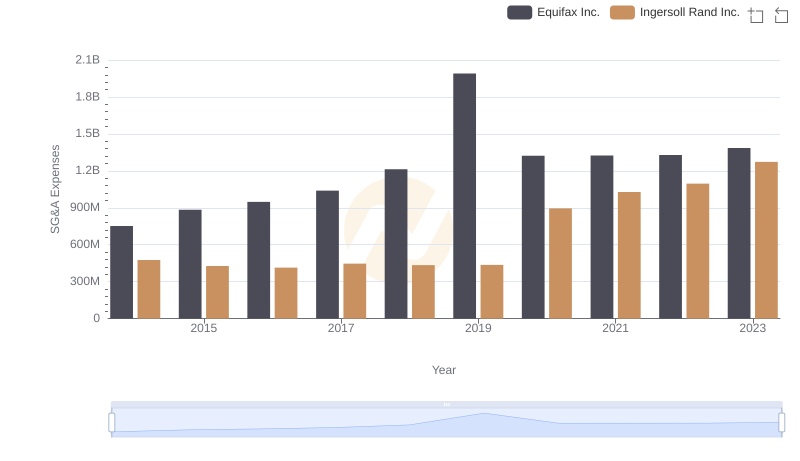
Ingersoll Rand Inc. or Equifax Inc.: Who Manages SG&A Costs Better?
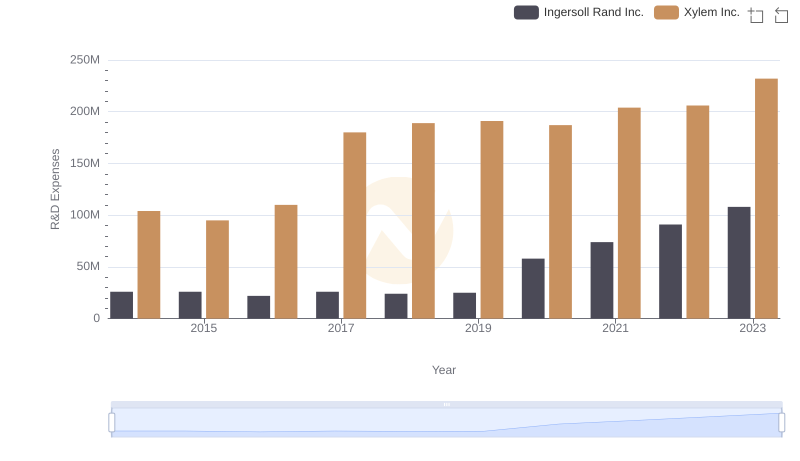
Research and Development Investment: Ingersoll Rand Inc. vs Xylem Inc.
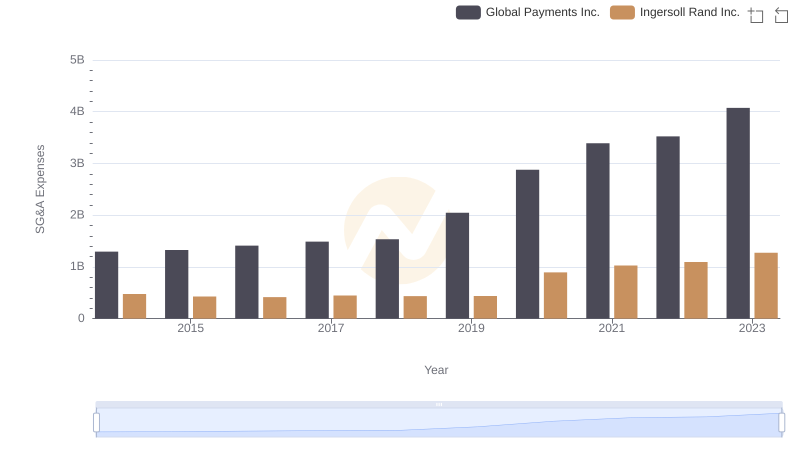
Cost Management Insights: SG&A Expenses for Ingersoll Rand Inc. and Global Payments Inc.
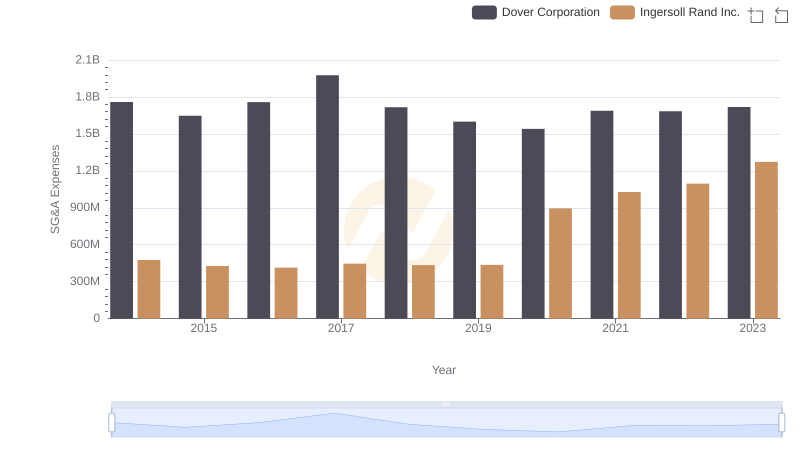
SG&A Efficiency Analysis: Comparing Ingersoll Rand Inc. and Dover Corporation
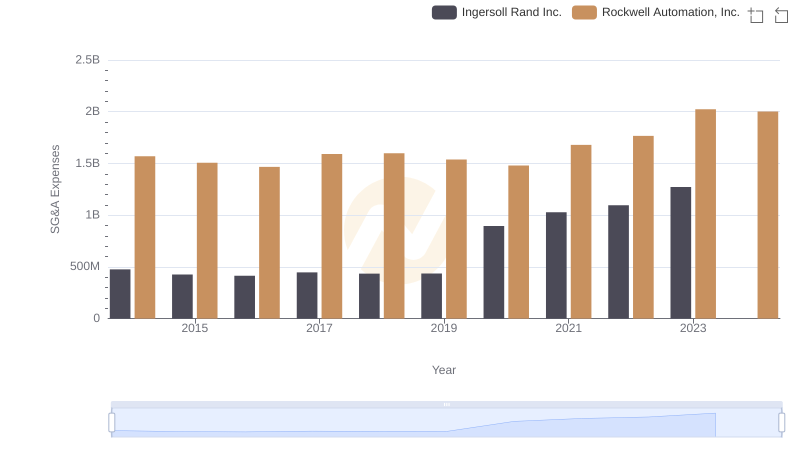
Comparing SG&A Expenses: Ingersoll Rand Inc. vs Rockwell Automation, Inc. Trends and Insights
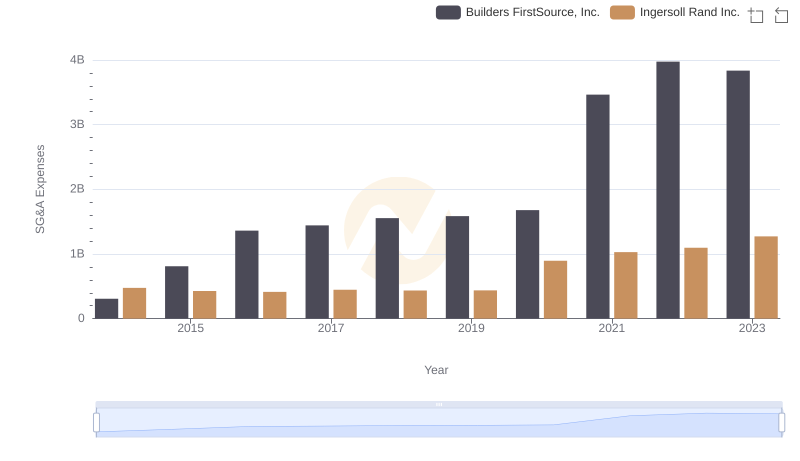
Cost Management Insights: SG&A Expenses for Ingersoll Rand Inc. and Builders FirstSource, Inc.